

Know whichjobs makemoney.
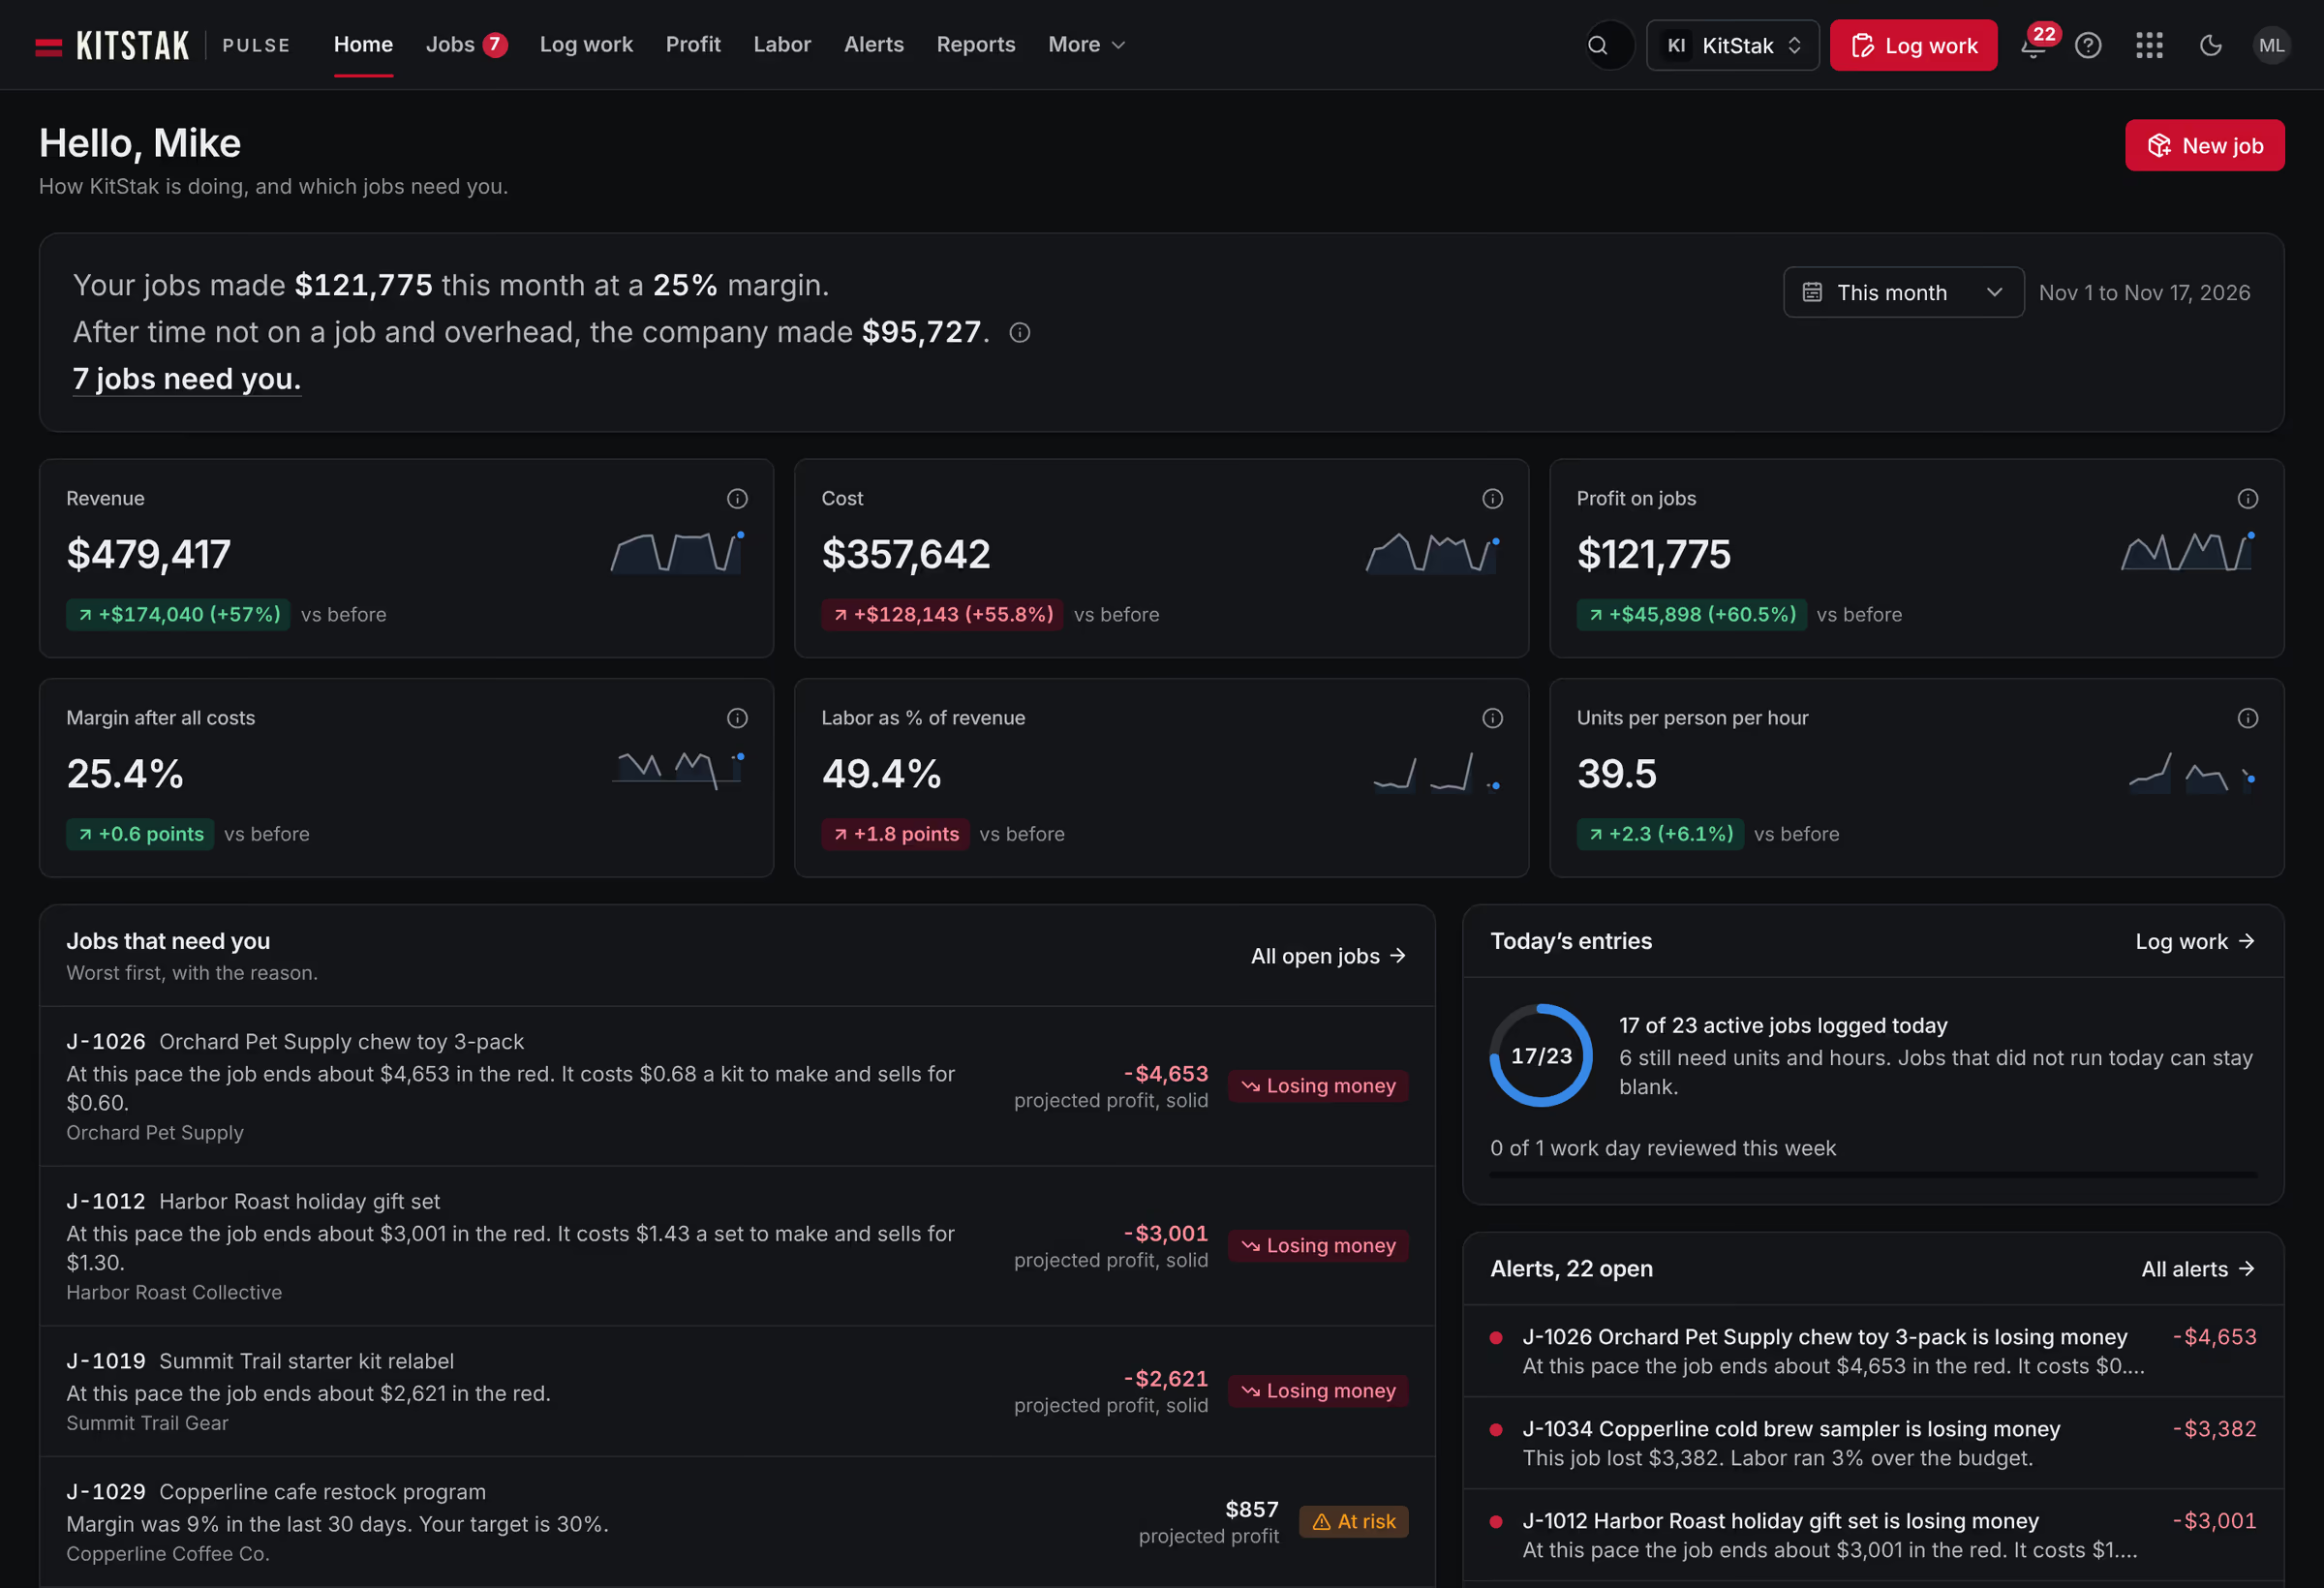
For kitting, 3PL and contract packaging shops. Log units and hours each day. Pulse shows the profit on every job, job type, client and extra service. It tells you which open jobs are losing money, and why.
- 8
- ways to cut profit, from jobs and clients to weeks and days
- 5
- plain statuses for every open job
- 17
- kinds of data in and out by CSV
- 19
- ready made reports
01The problem
Busy is not the same as profitable.
You finish the work and send the bill. Weeks later, or never, you learn which jobs paid. By then the job is done and the price is set.
- The busy month that made no moneyThe floor ran flat out and the bank balance did not move. Without profit by job, you cannot tell which work to blame.
- The wage is not the costAn hour costs more than the wage. Payroll taxes, benefits and overhead ride on top.
- The surprise at the endA job can look fine until the last unit ships. By then it is too late to change the crew or the price.
02The math
Revenue. Cost. Profit.
Revenue is the money a job earns. Cost is what the work took. Profit is what is left. You log units, people and hours. Pulse does the sums and shows them.
- Four kinds of costLabor at what an hour really costs. Materials you pay for. Other costs like freight. And time not on a job, such as meetings and cleanup.
- Same day numbersSave an entry and the profit updates. There is no nightly run to wait for.
| Line | Amount |
|---|---|
| Revenue4,000 units × $1.75 a unit | $7,000.00 |
| Labor cost125 hours × $23.00 an hour, the crew average | $2,875.00 |
| Material costParts and supplies you paid for, $90.00 of it scrap | $1,900.00 |
| Other costFreight and other costs put on this job | $400.00 |
| Time not on a jobThis job's share of meetings, cleanup and waiting | $260.00 |
| Total costThe four costs added up | $5,435.00 |
| Profit so far$7,000.00 less $5,435.00. Margin 22.4% | $1,565.00 |
Labor is heading 25% over the plan. That is labor hours: 125 used where the plan for these units was 100. At this pace the whole job ends with $3,912.50 of profit. The budget for the whole job was $6,000.00.
A worked example with sample numbers, not a screenshot. Check the sum with a calculator.
03Profit
Profit, any way you cut it.
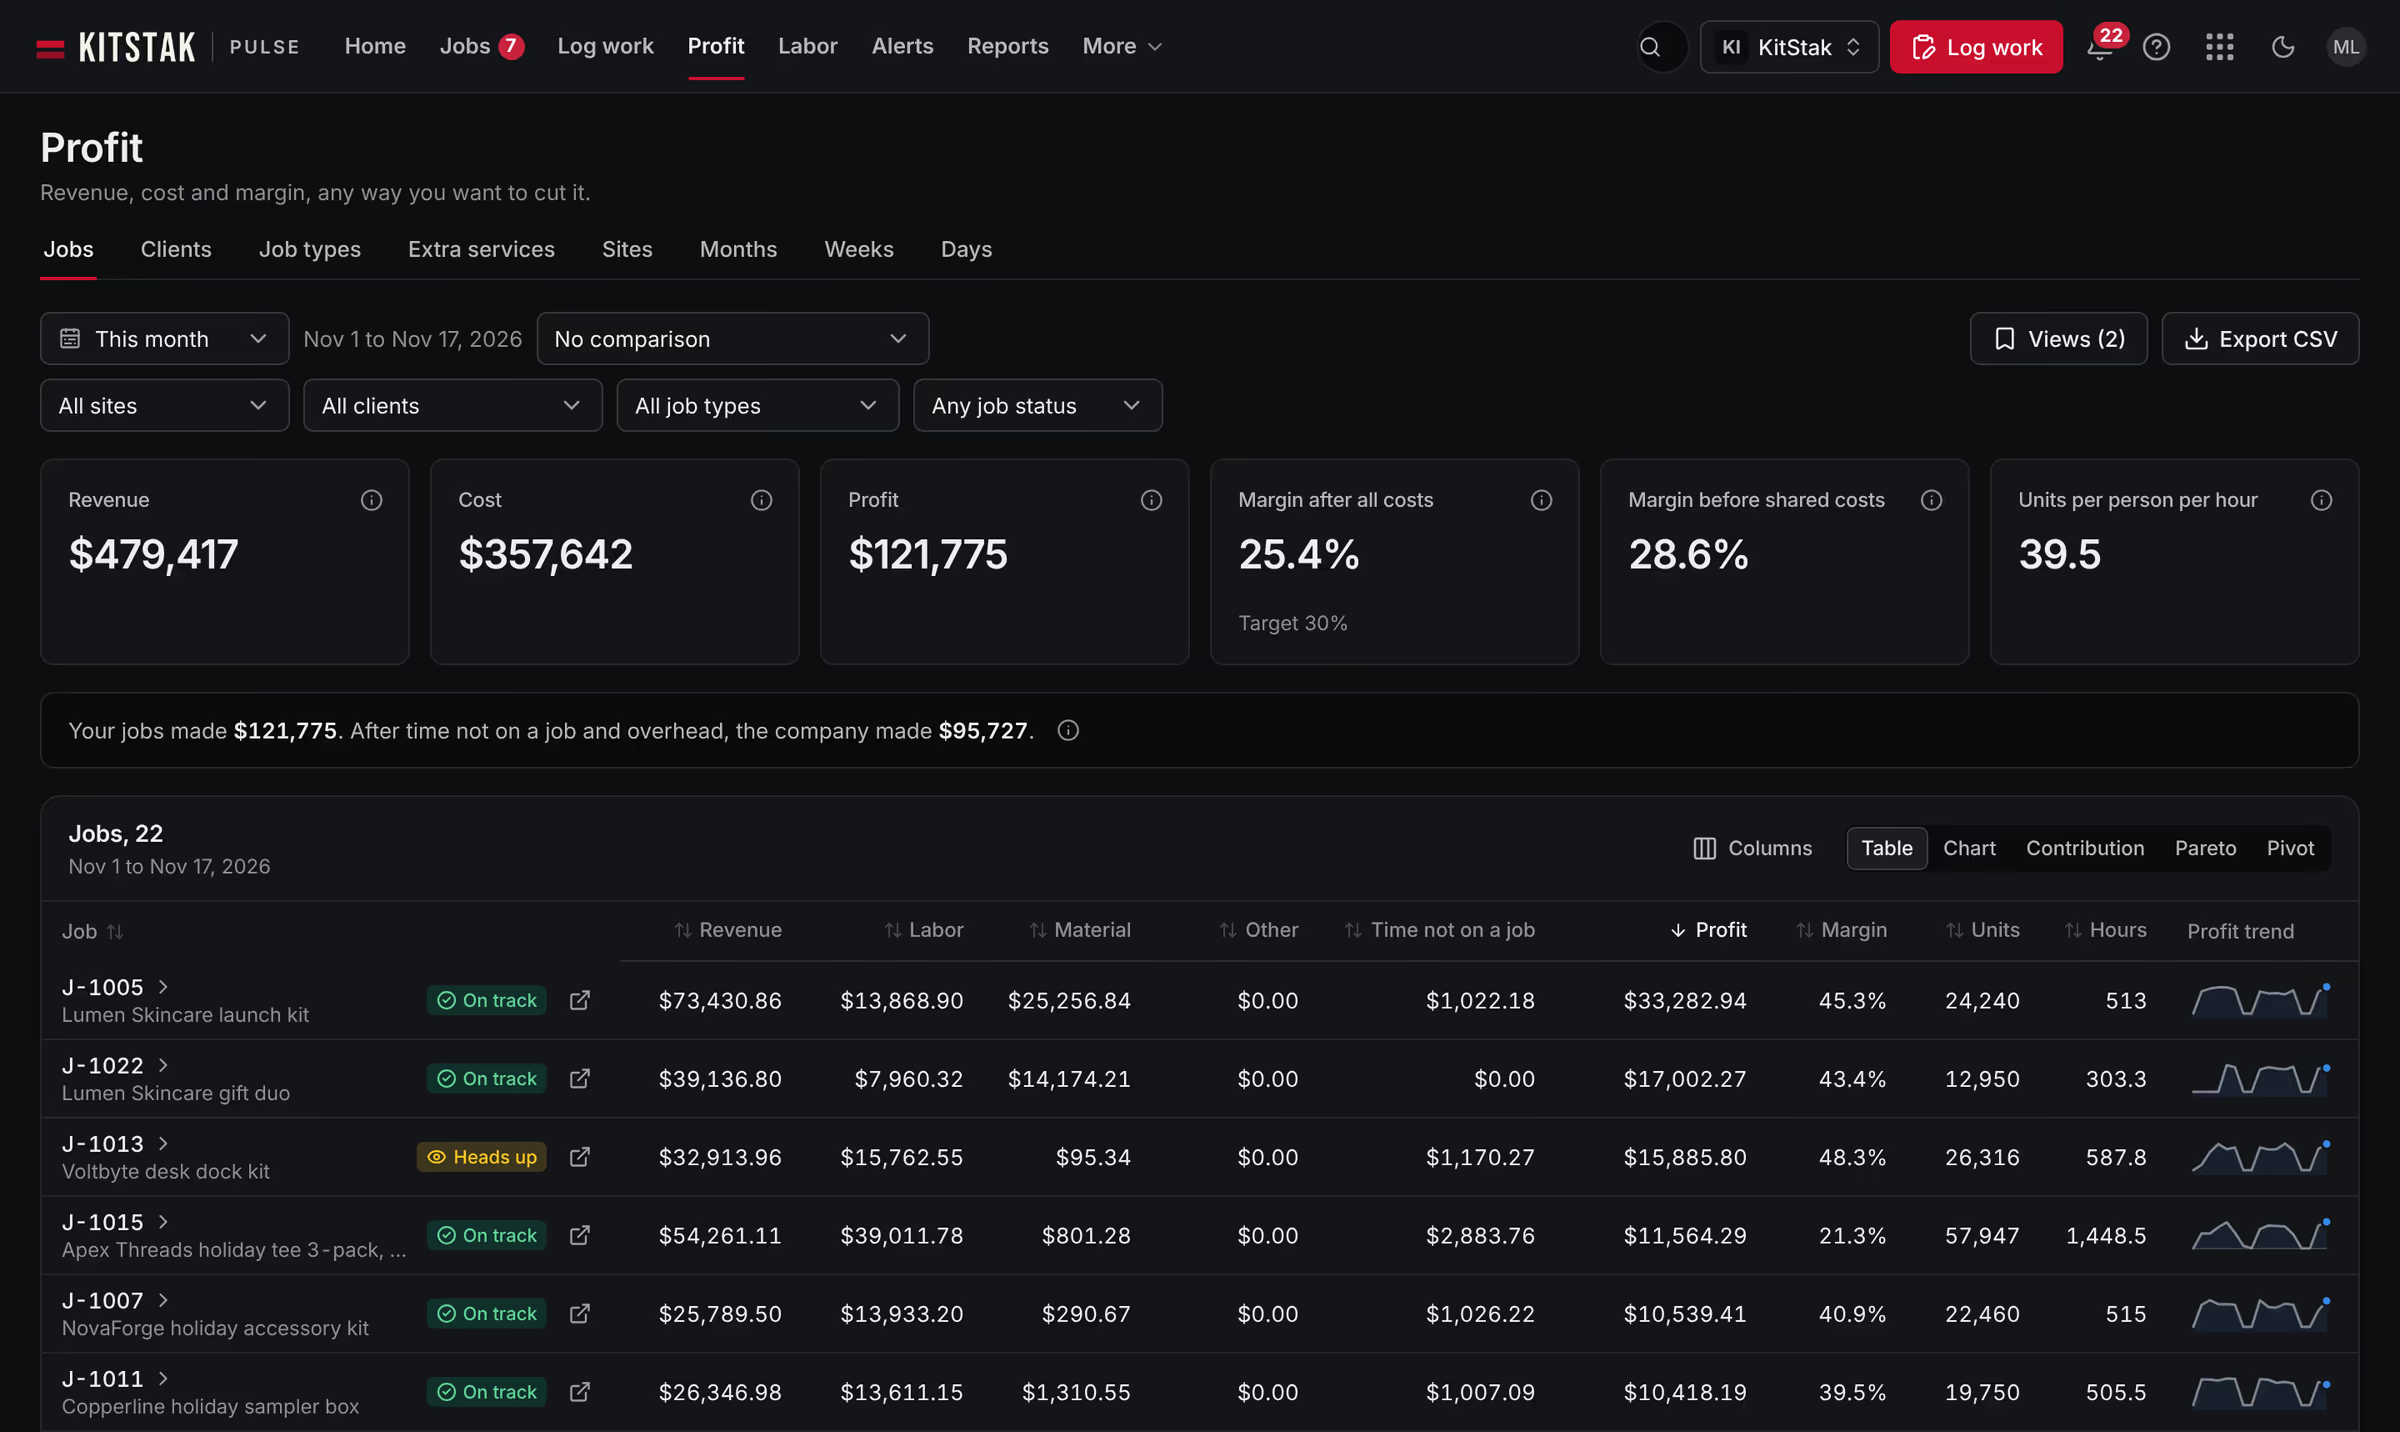
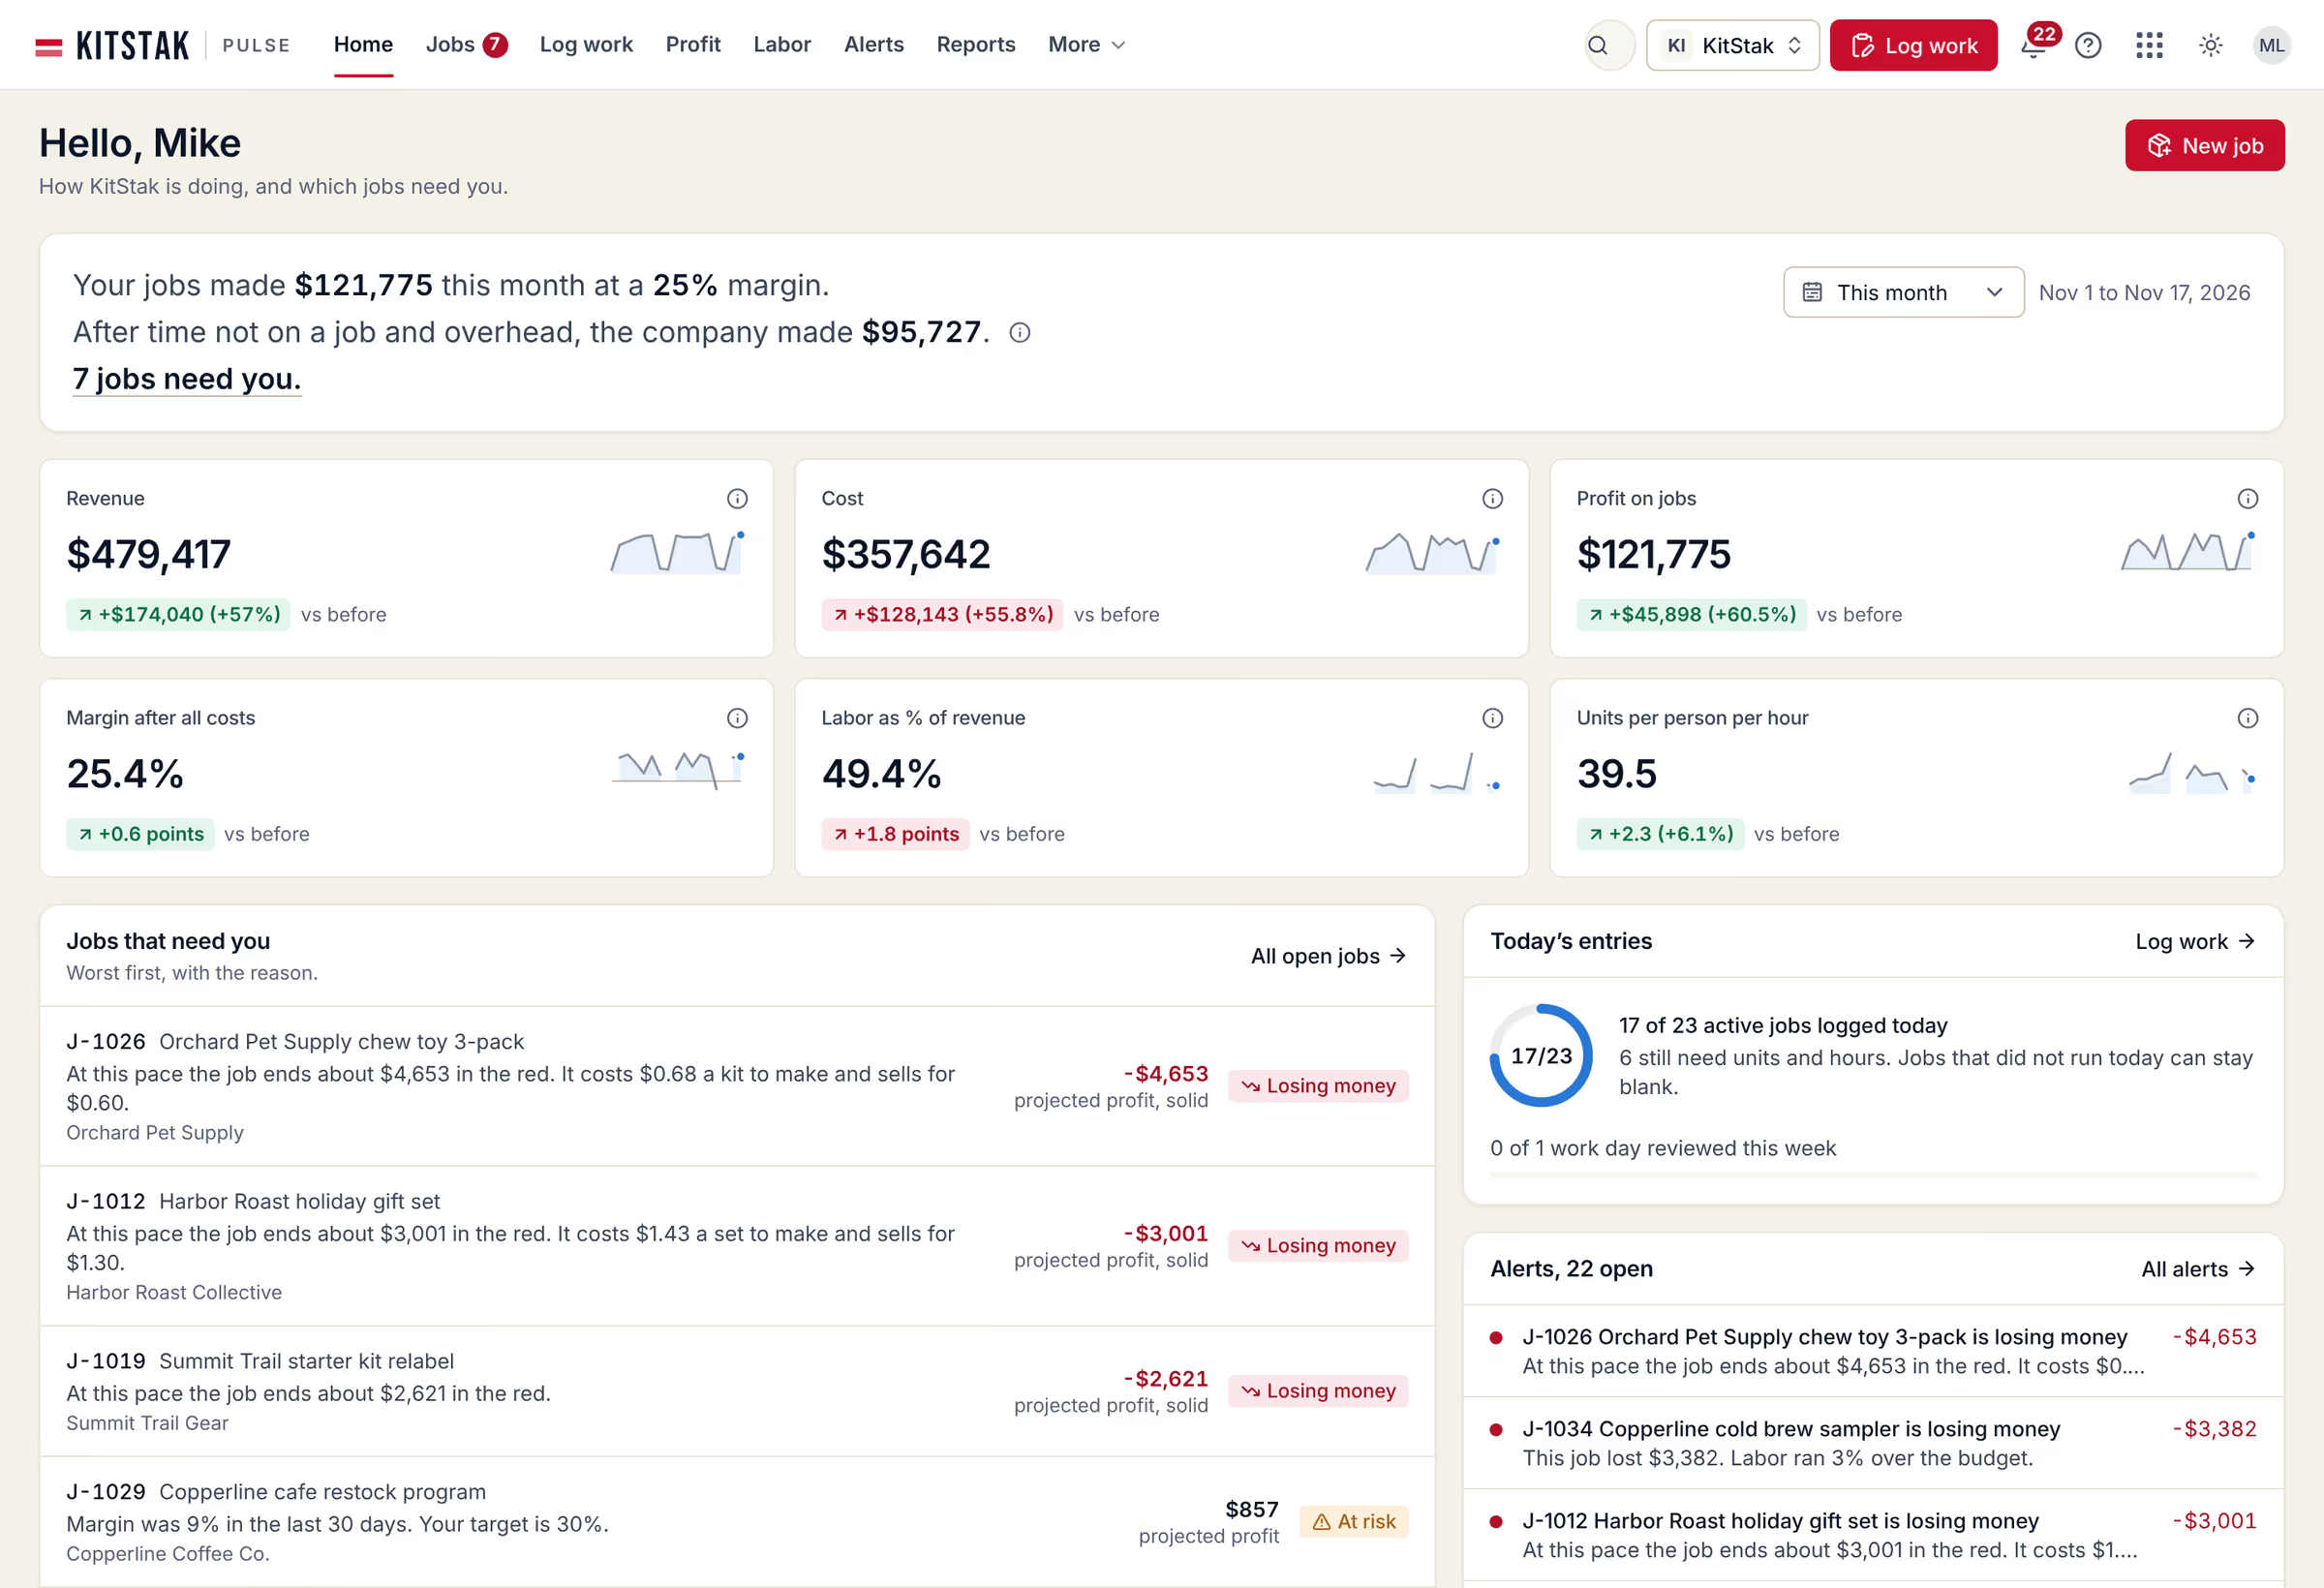
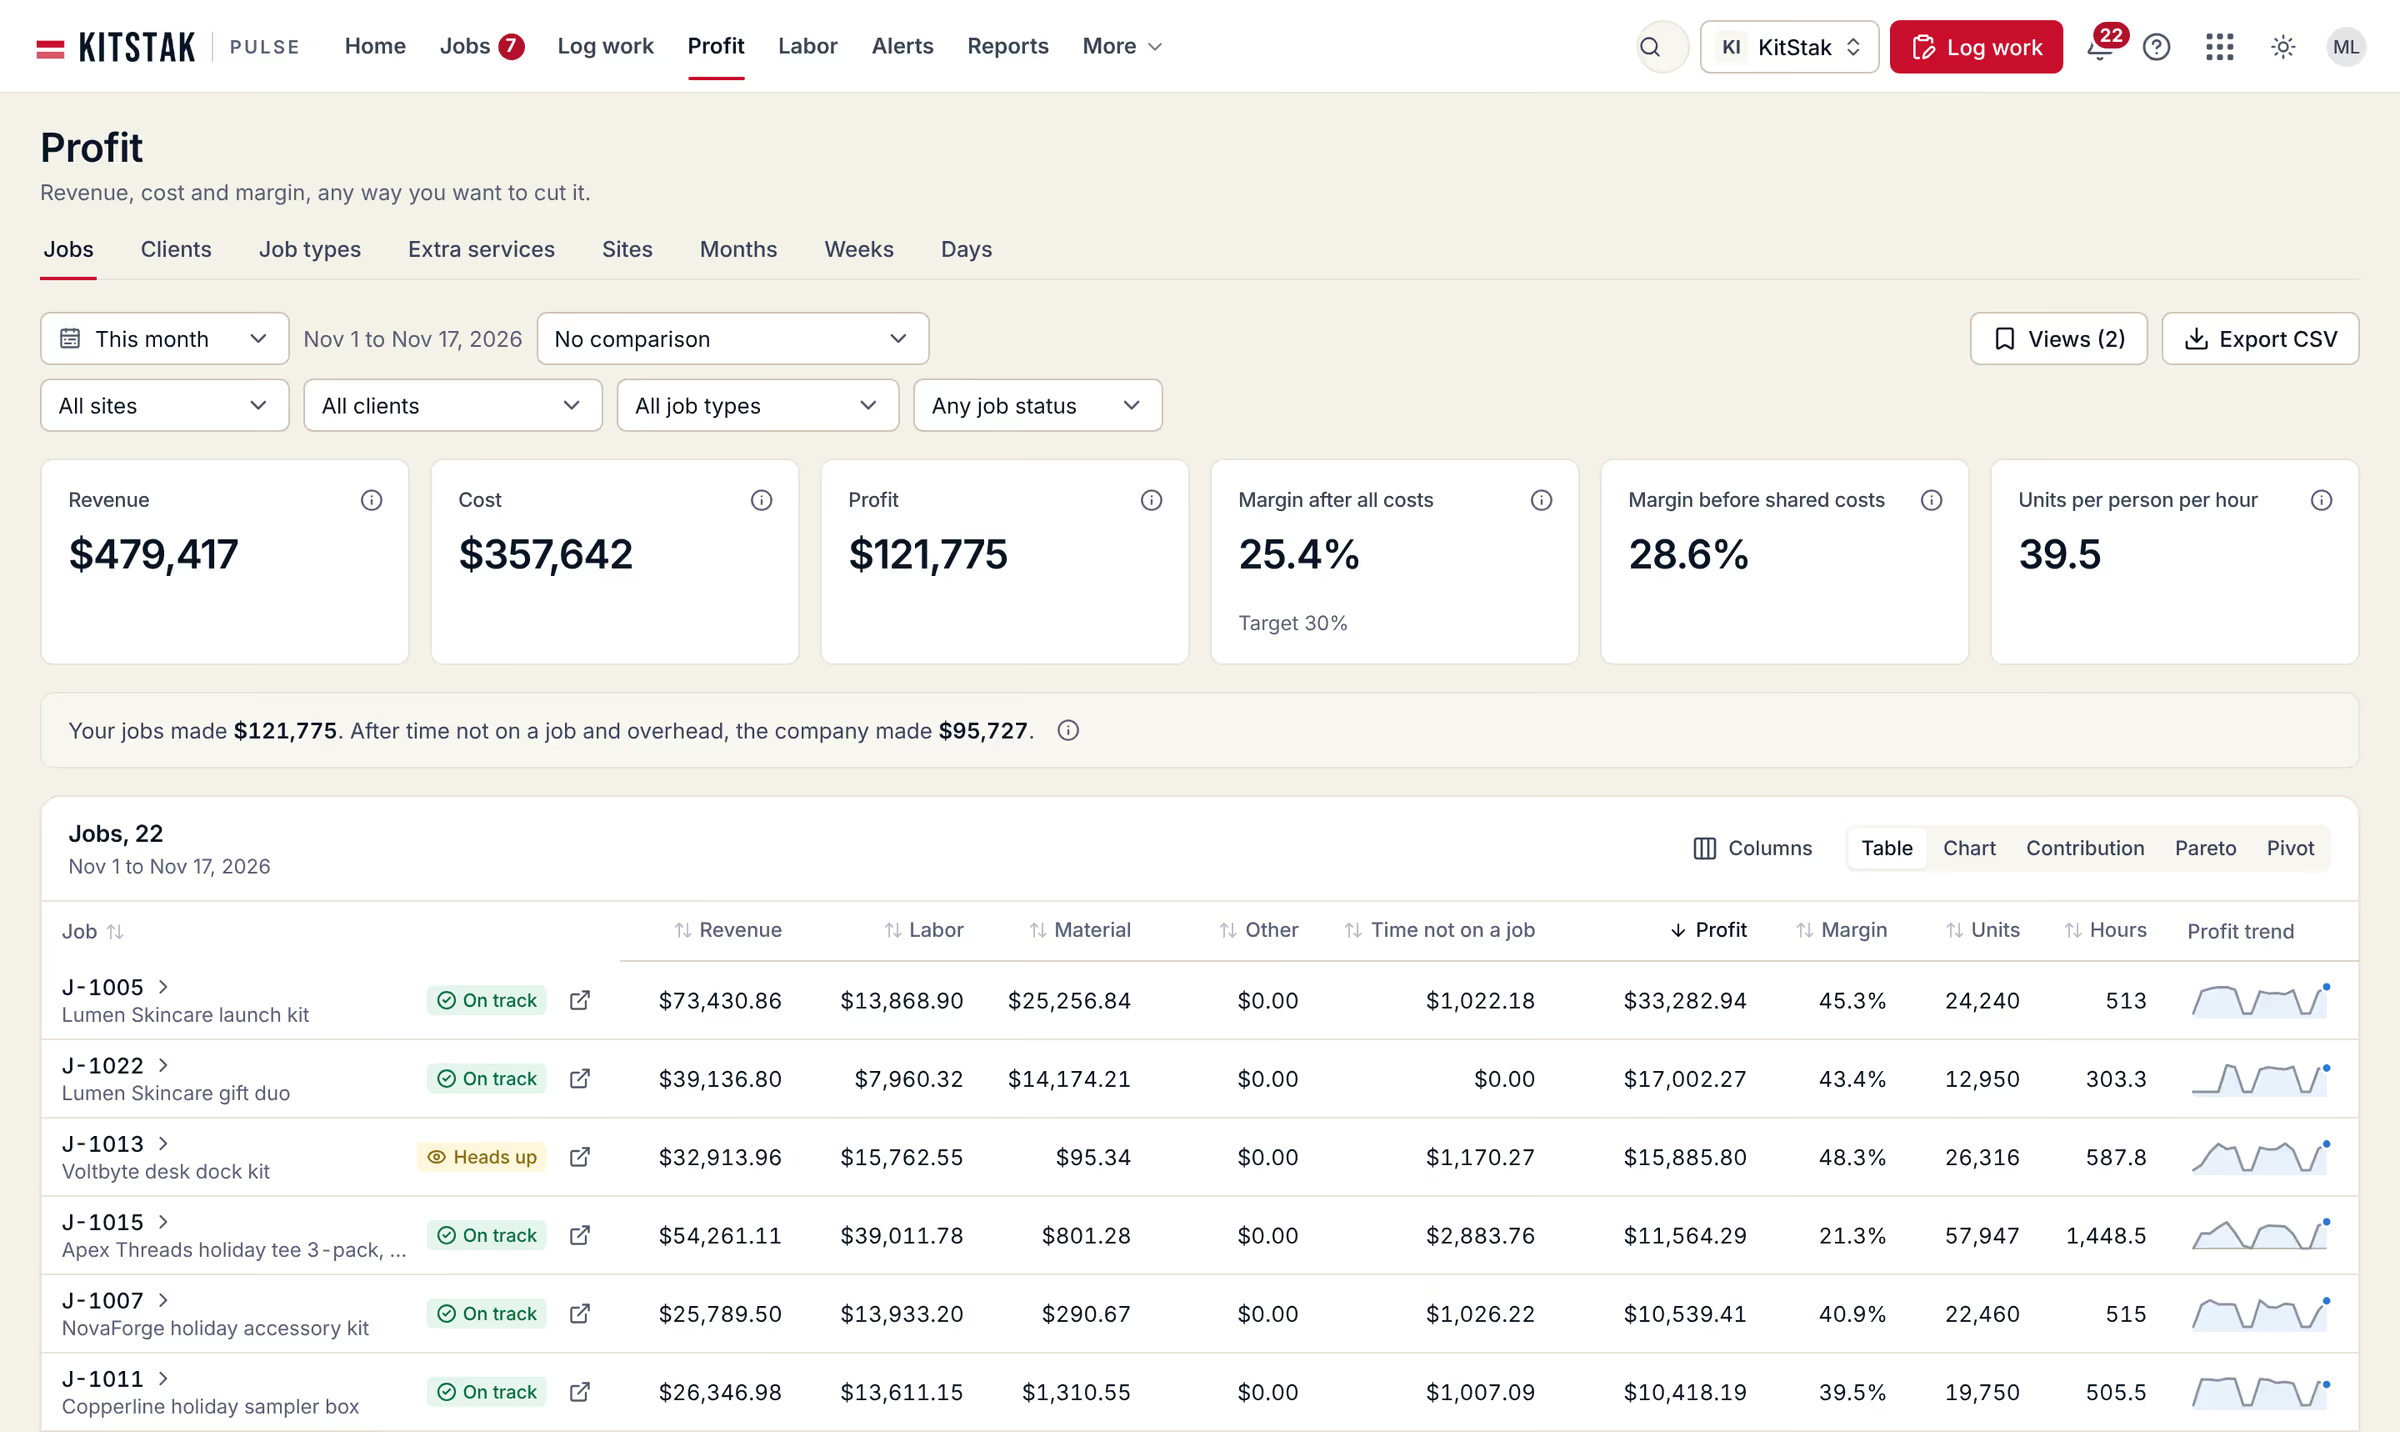
See revenue, cost, profit and margin by job, client, job type and extra service. Or by site, month, week and day.
- Every job in one tableEach job shows its revenue, profit and margin. A wide screen adds its status and the four costs. Sort by any column, or switch to a chart.
- Clients and extra servicesOpen a client to see cost to serve. That is what the client costs you for each unit and each job. You also see what is not billed yet. Open an extra service to see its revenue, cost and margin.
- Drill down that adds upOpen a client to see its jobs. Open a job to see its days. Totals always match the level above.
04At risk
Catch it before it ends.
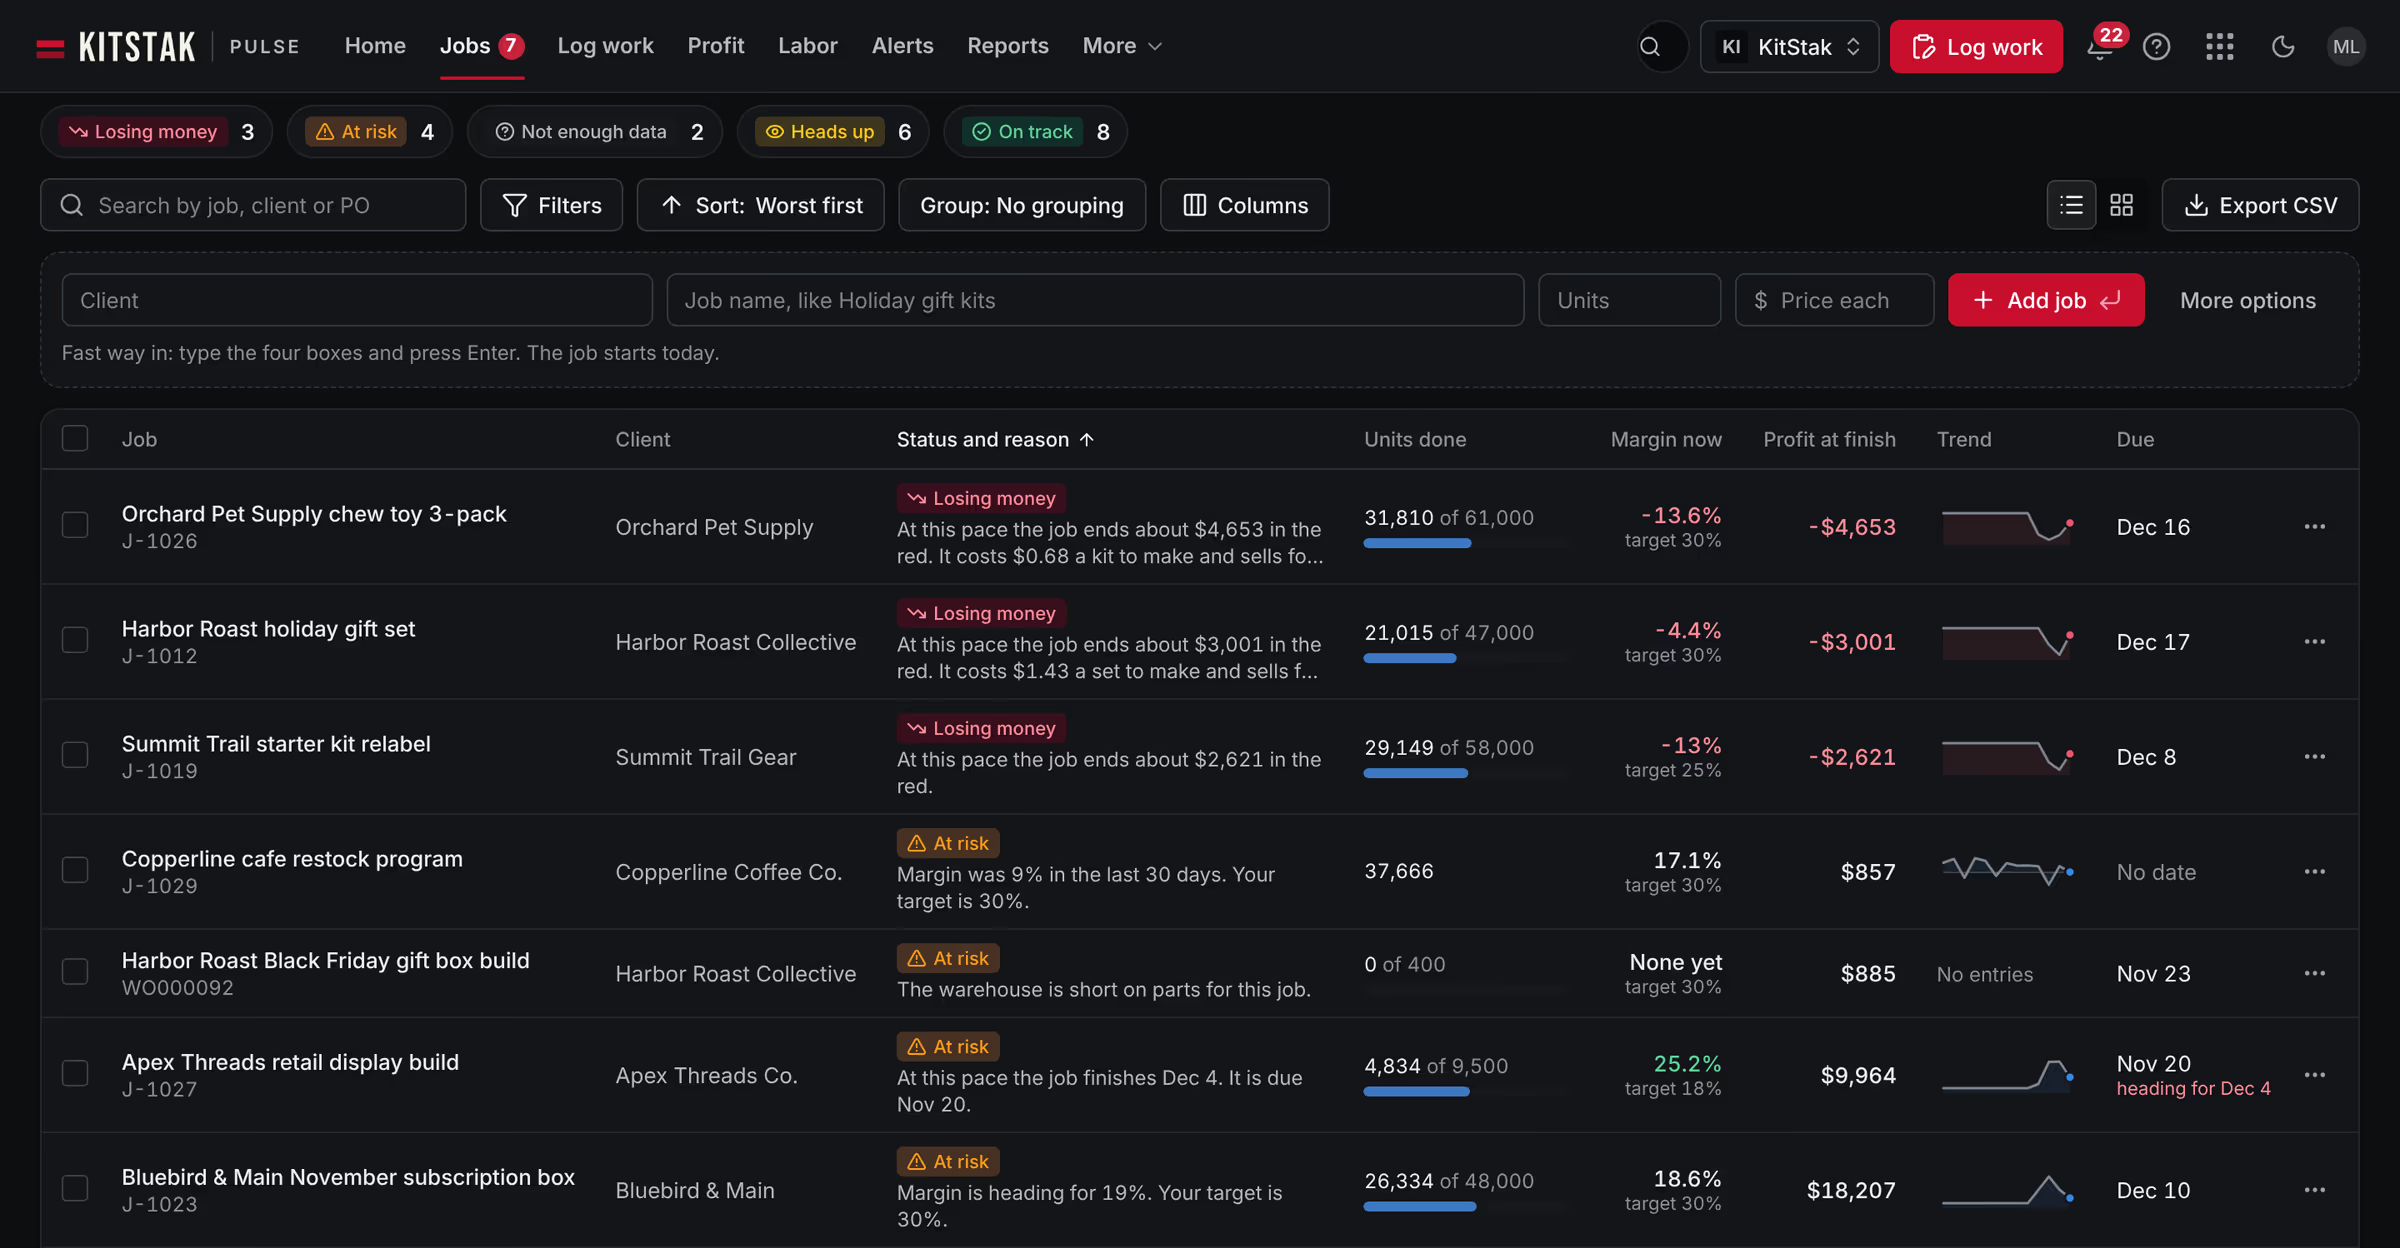
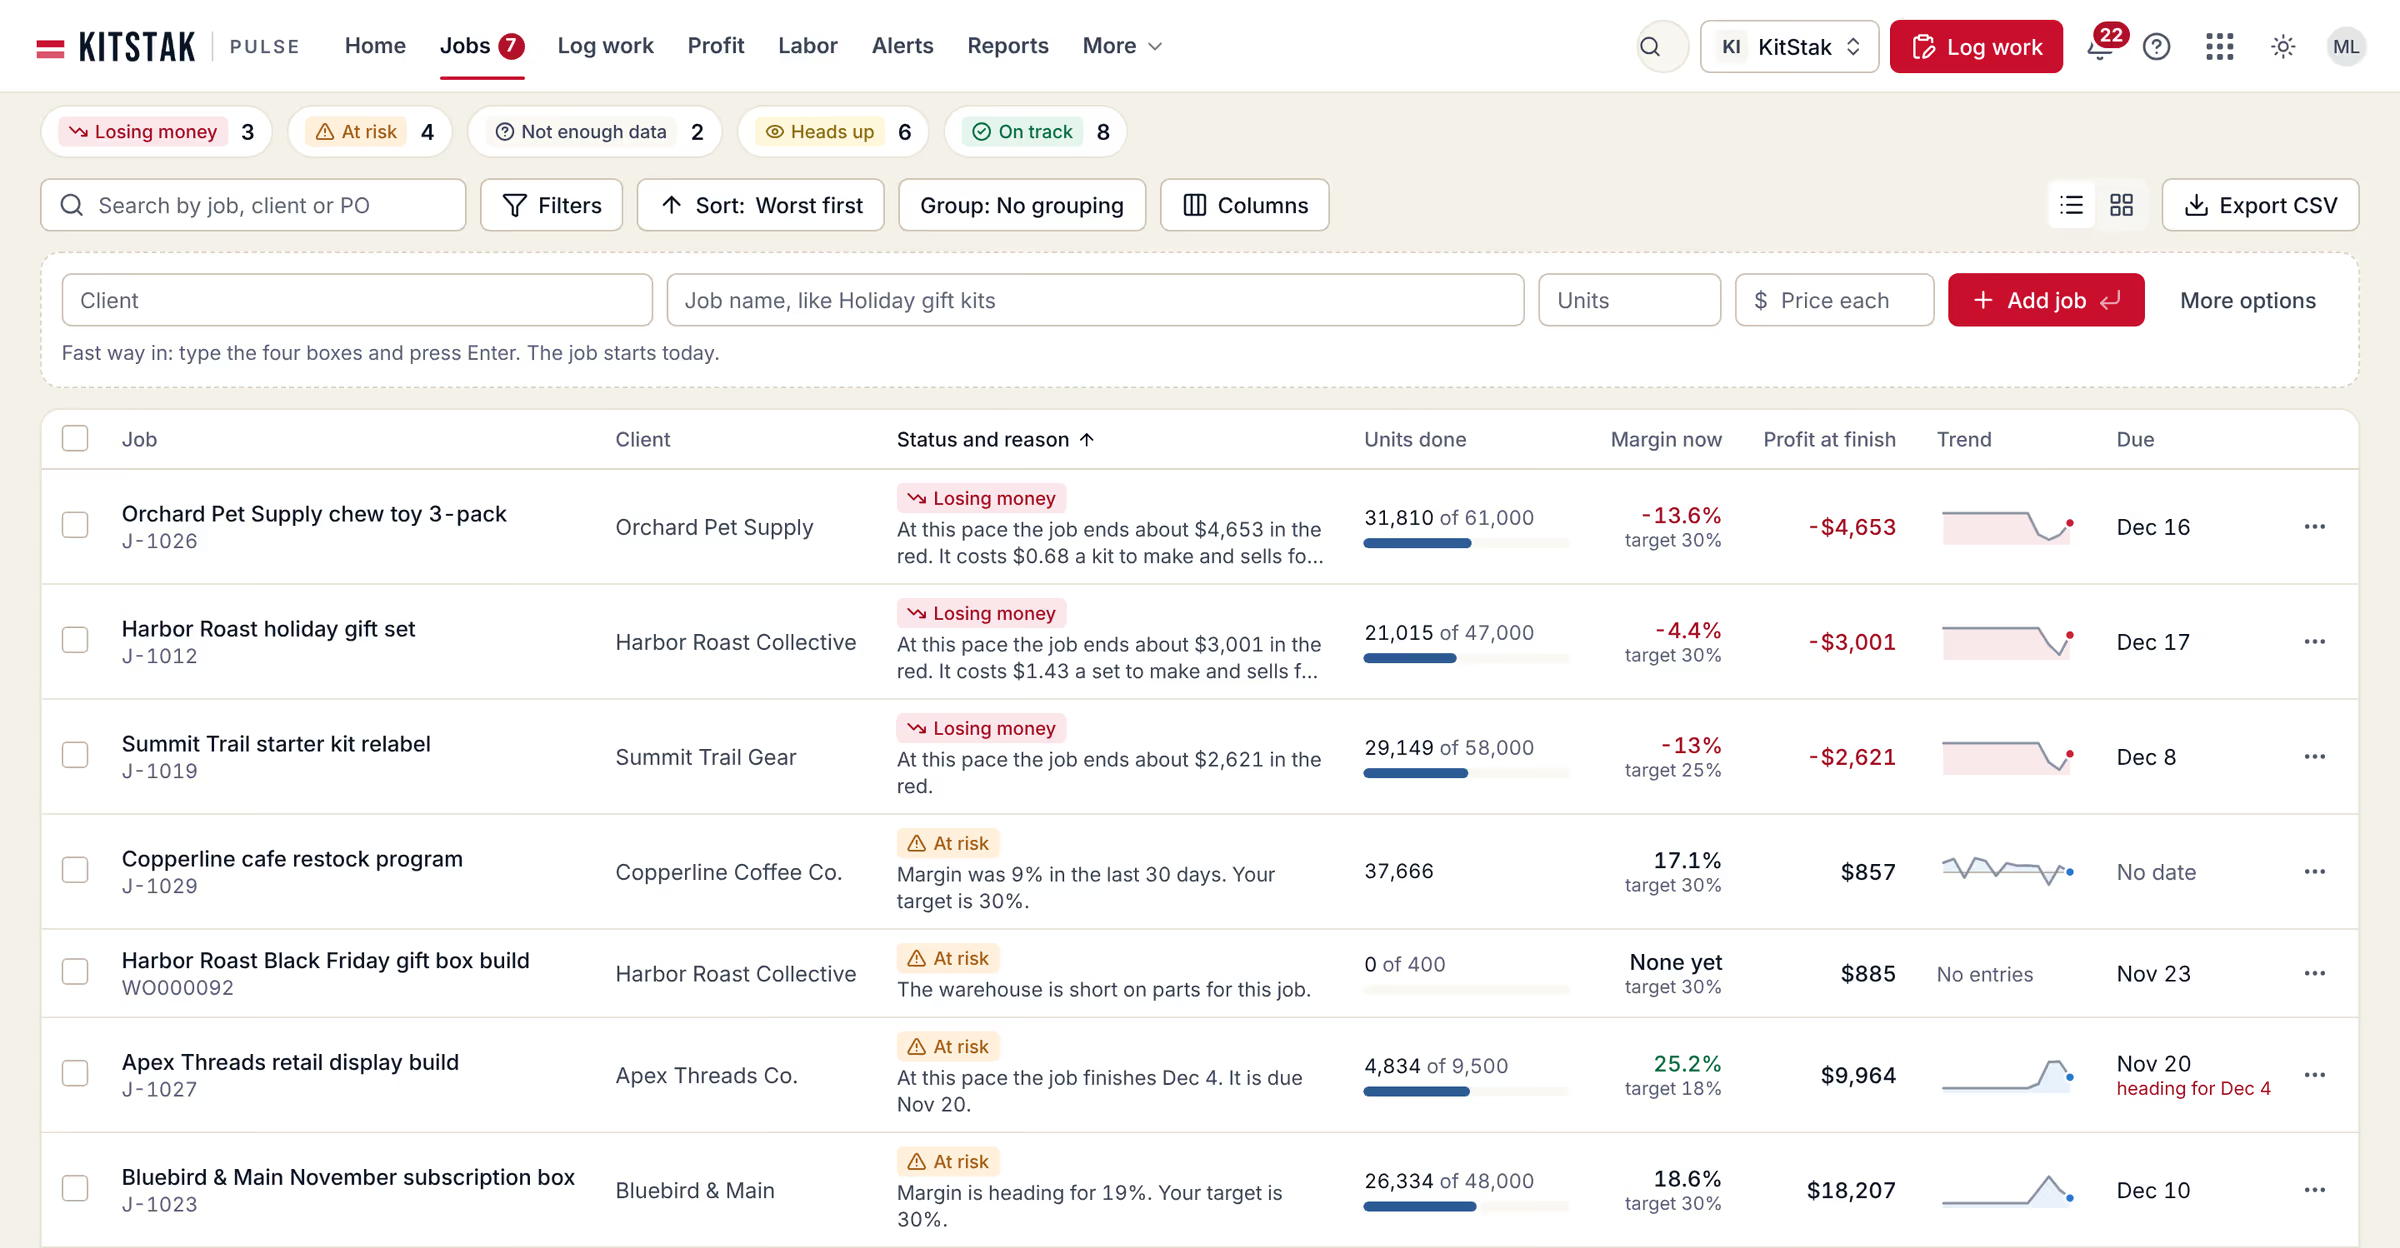
Pulse works out where each open job is heading, from your recent pace and the plan. Ongoing work is judged on its last 30 days. Each job gets one of five statuses, with the reason in a sentence.
- Five plain statusesLosing money, At risk, Not enough data, Heads up and On track. Always an icon and a word, never color alone.
- The money at stakeEach row shows the margin now and the profit the job is heading for at the finish. A wide screen adds your target.
- Alerts you can tuneEach alert says what happened, the money impact and the next step. Twelve rules come ready to tune or turn off.
05How we got this
Every number shows its work.
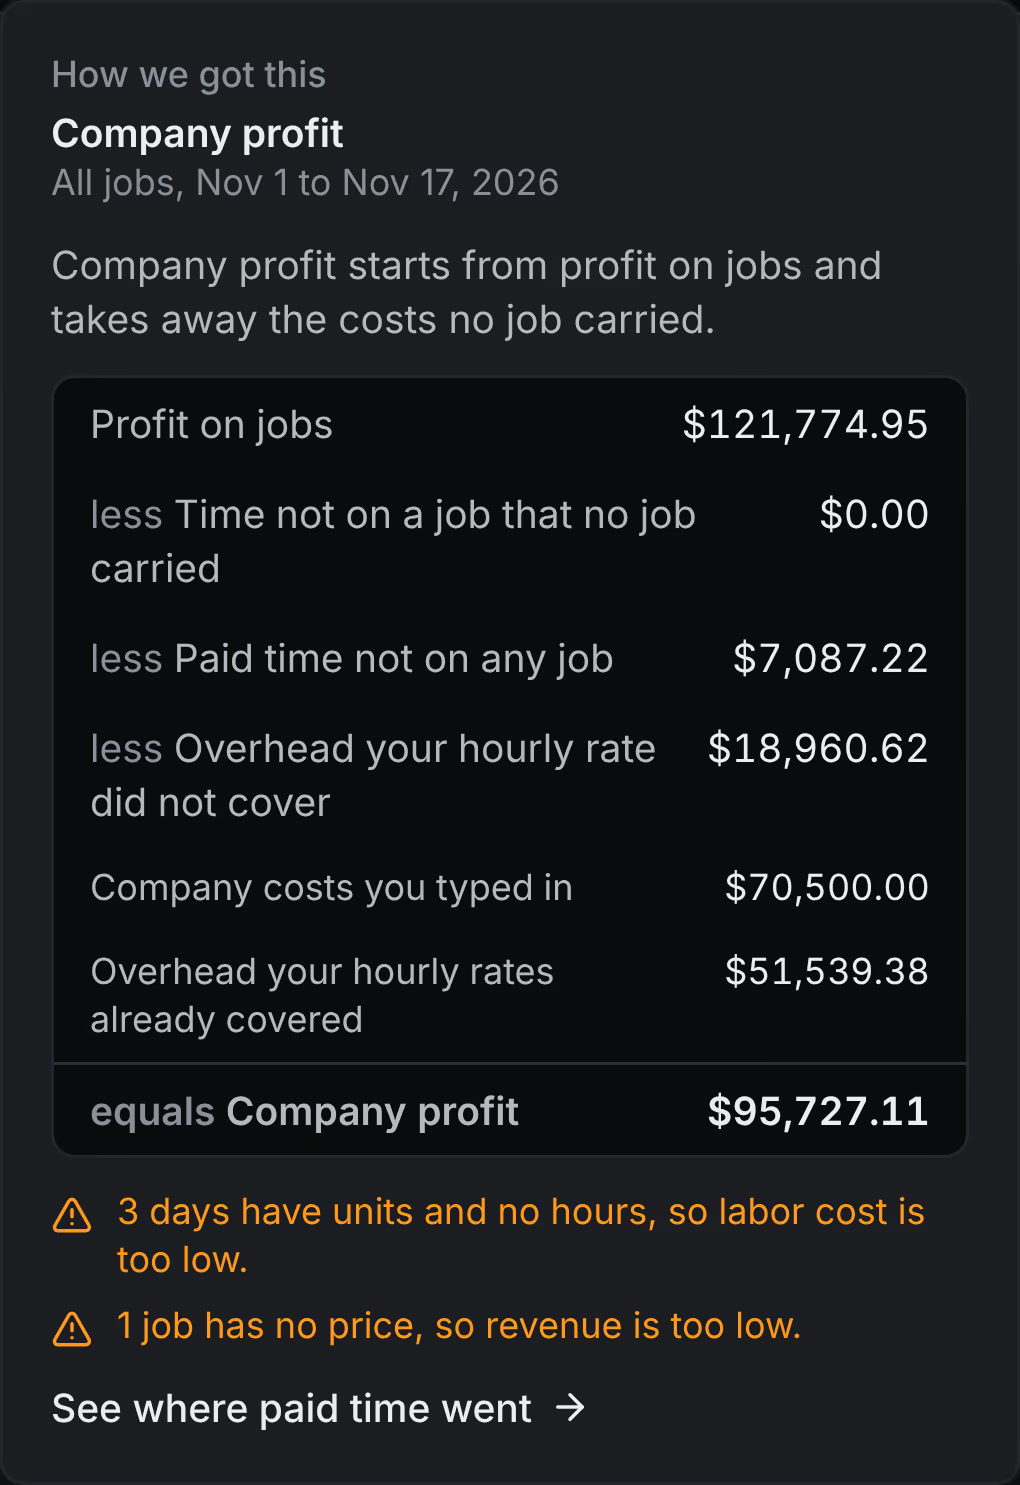
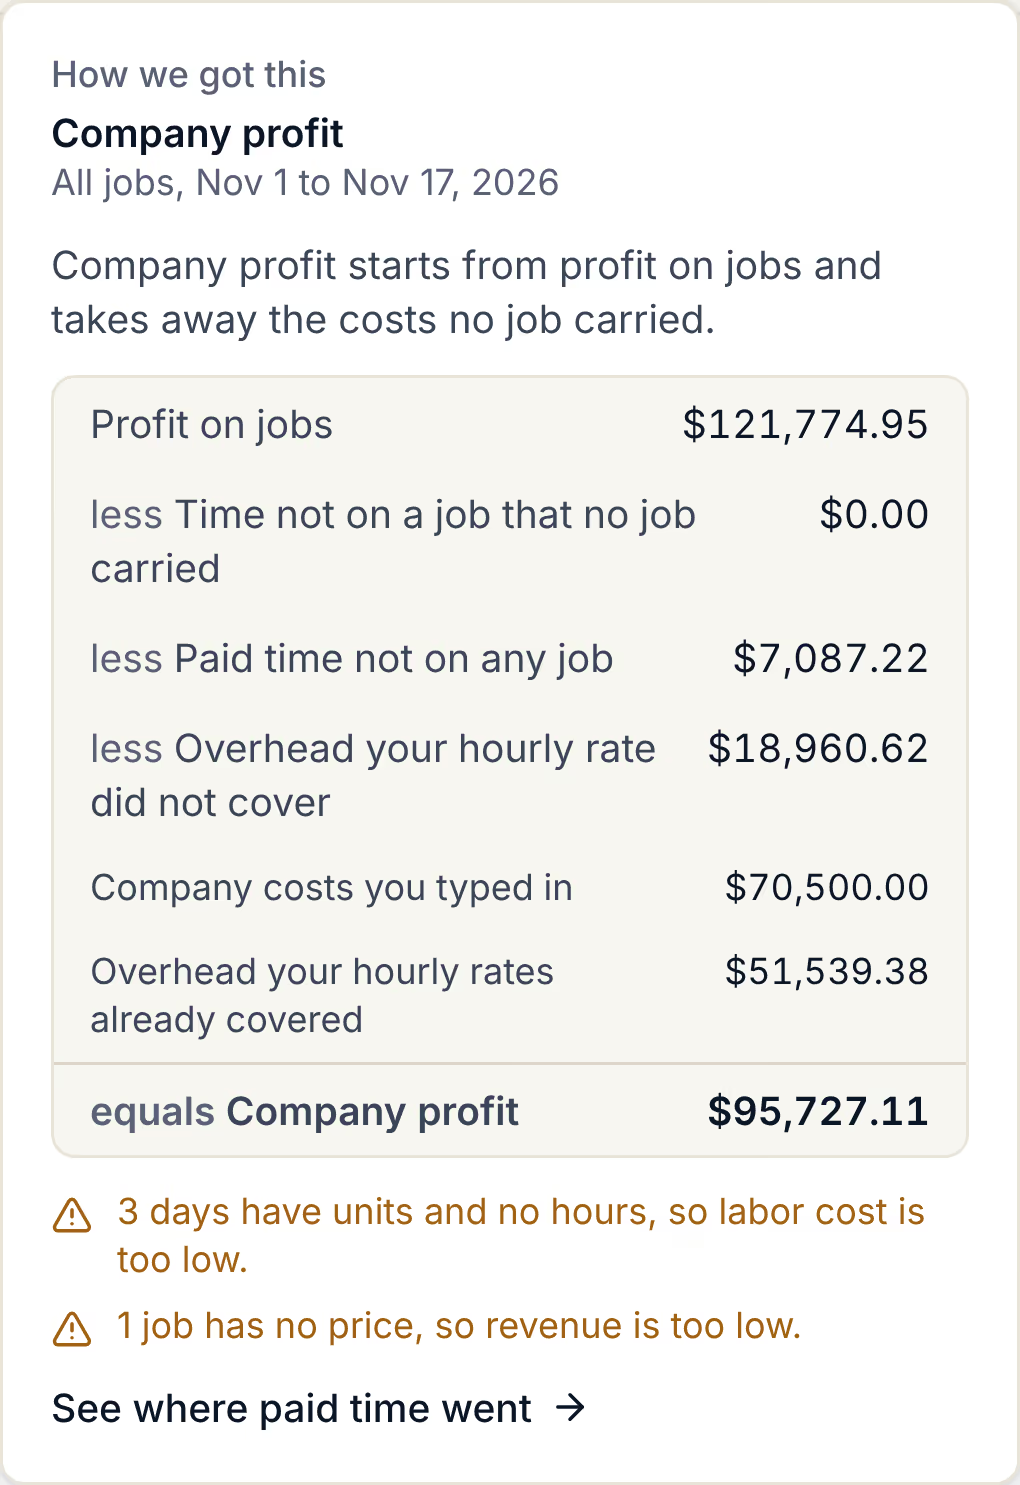
Open any money figure, margin or status. Pulse says in words how it got the number, shows each step with your figures, and links to what is behind it.
- Honest about gapsA number with no warning line is complete. One that is not complete says why.
- Job profit and company profitTwo numbers. The company also pays for rent, salaried staff and paid hours nobody logged. Pulse shows each step from job profit to company profit.
06Log work
The whole day on one screen.
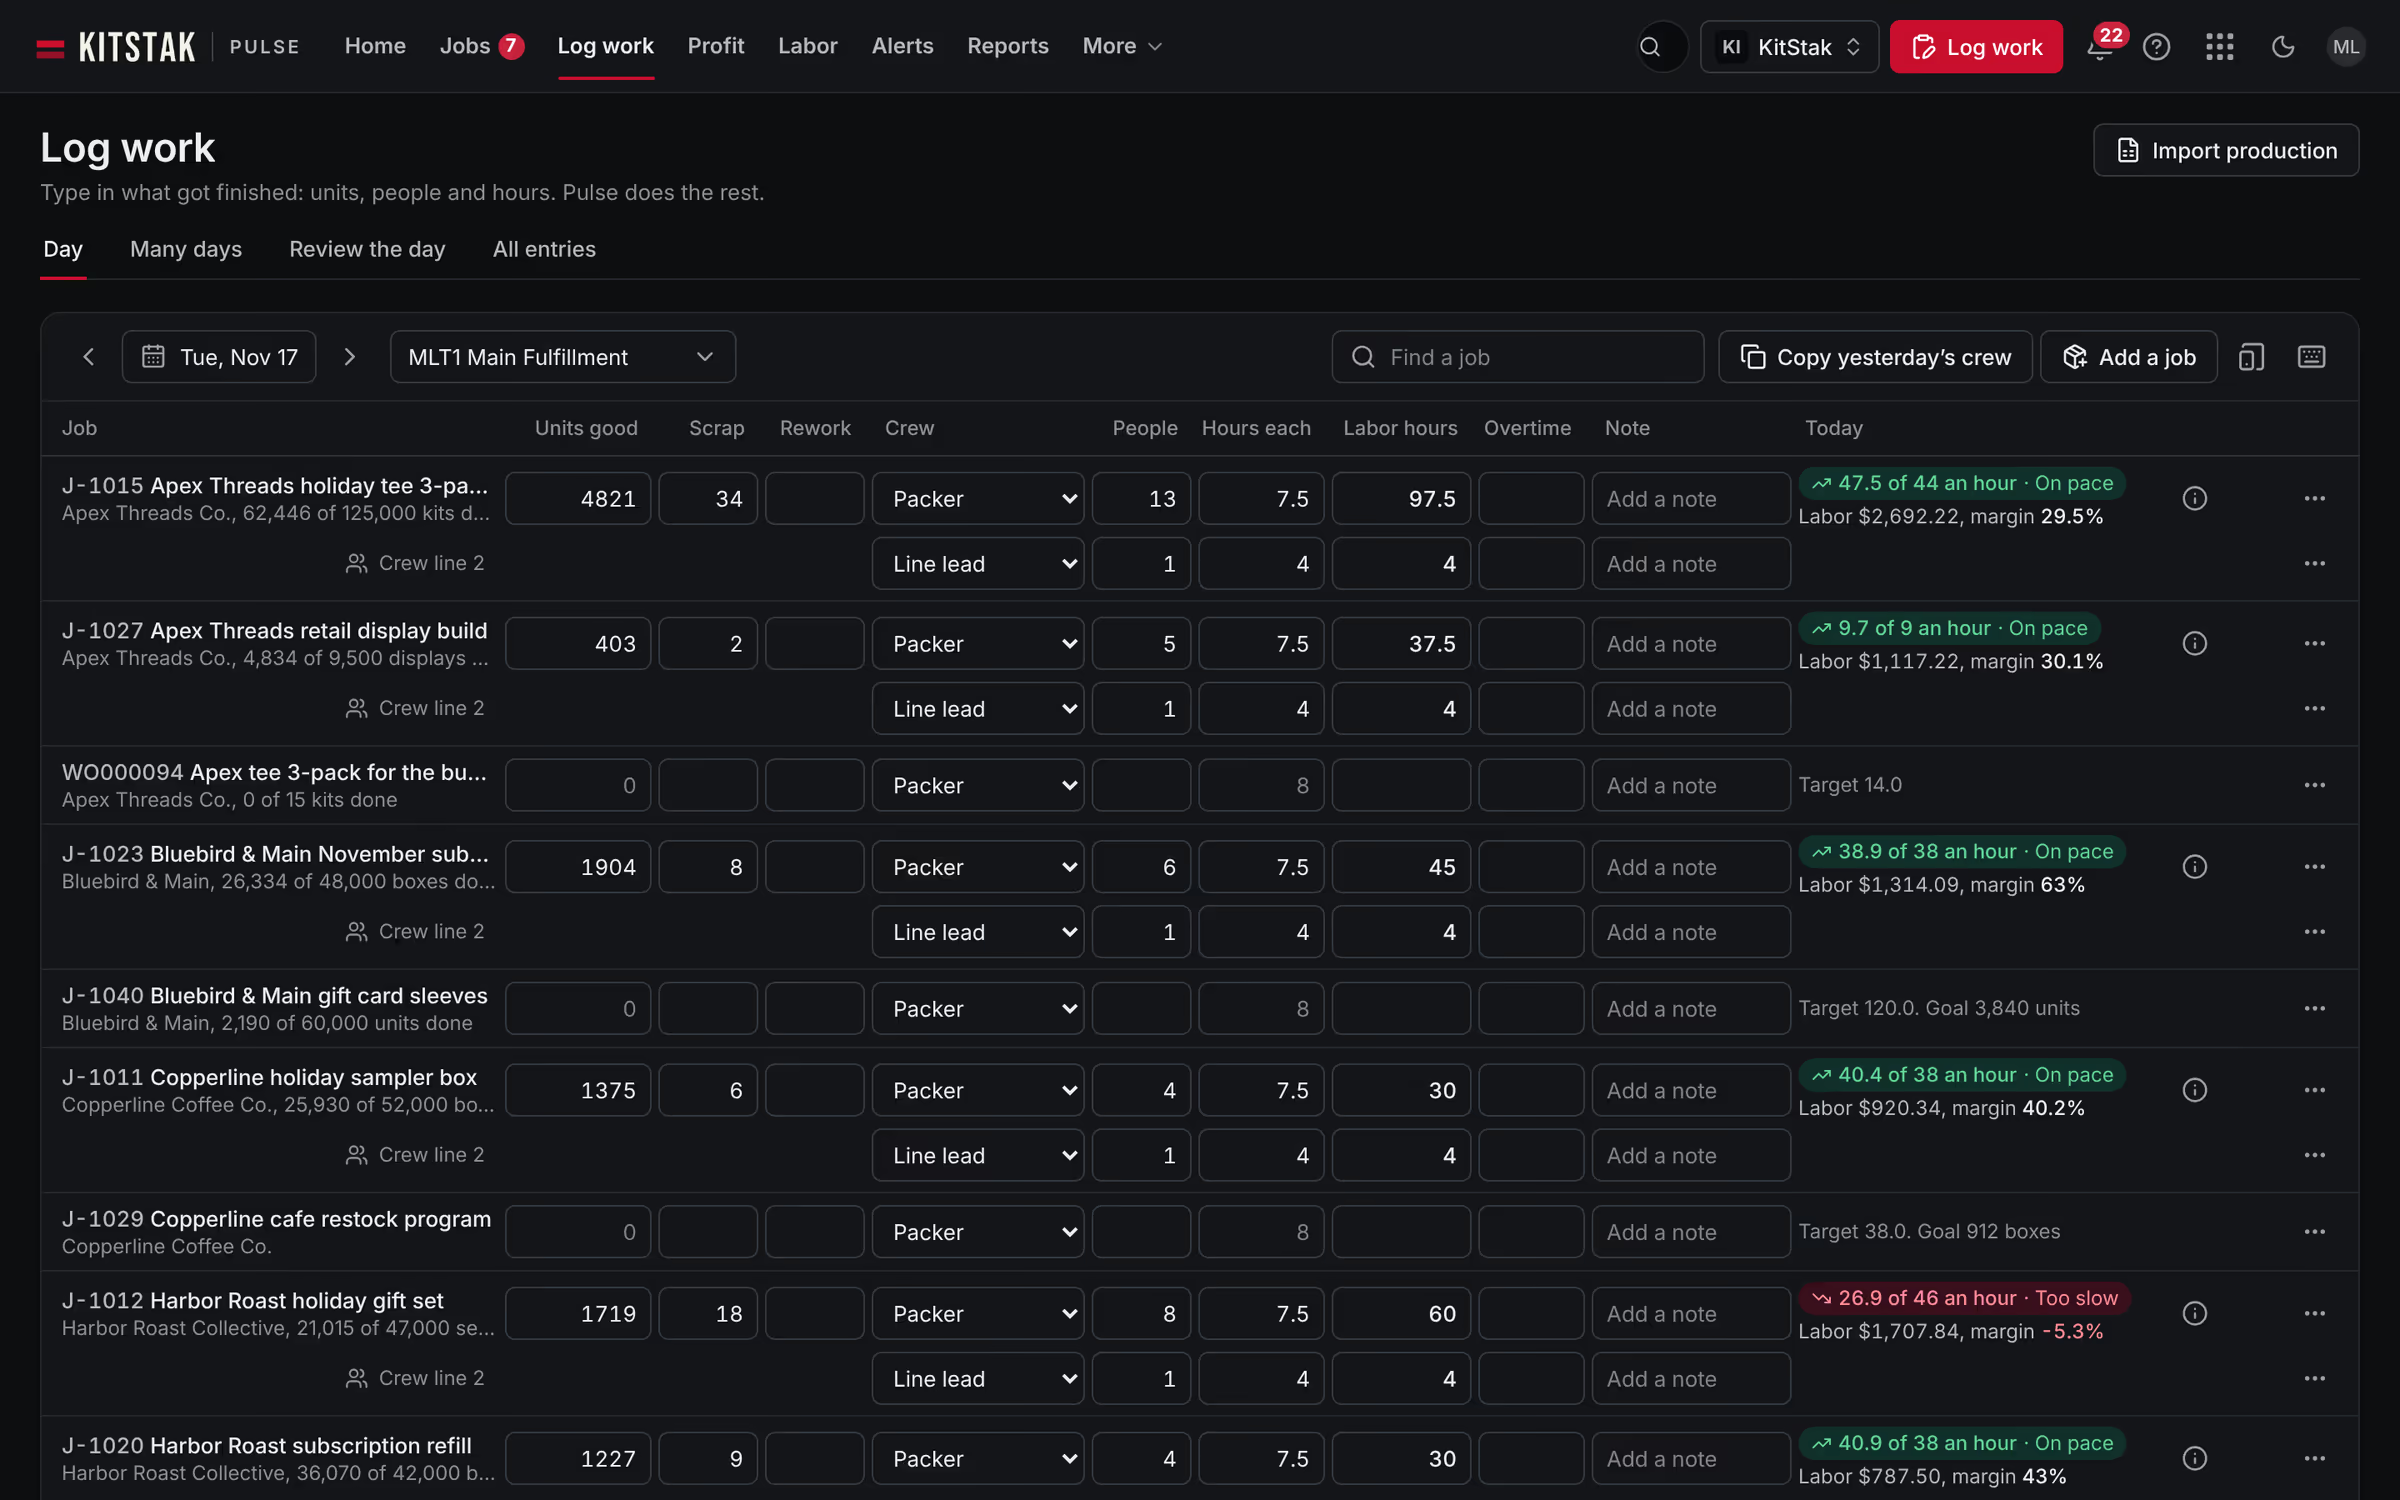
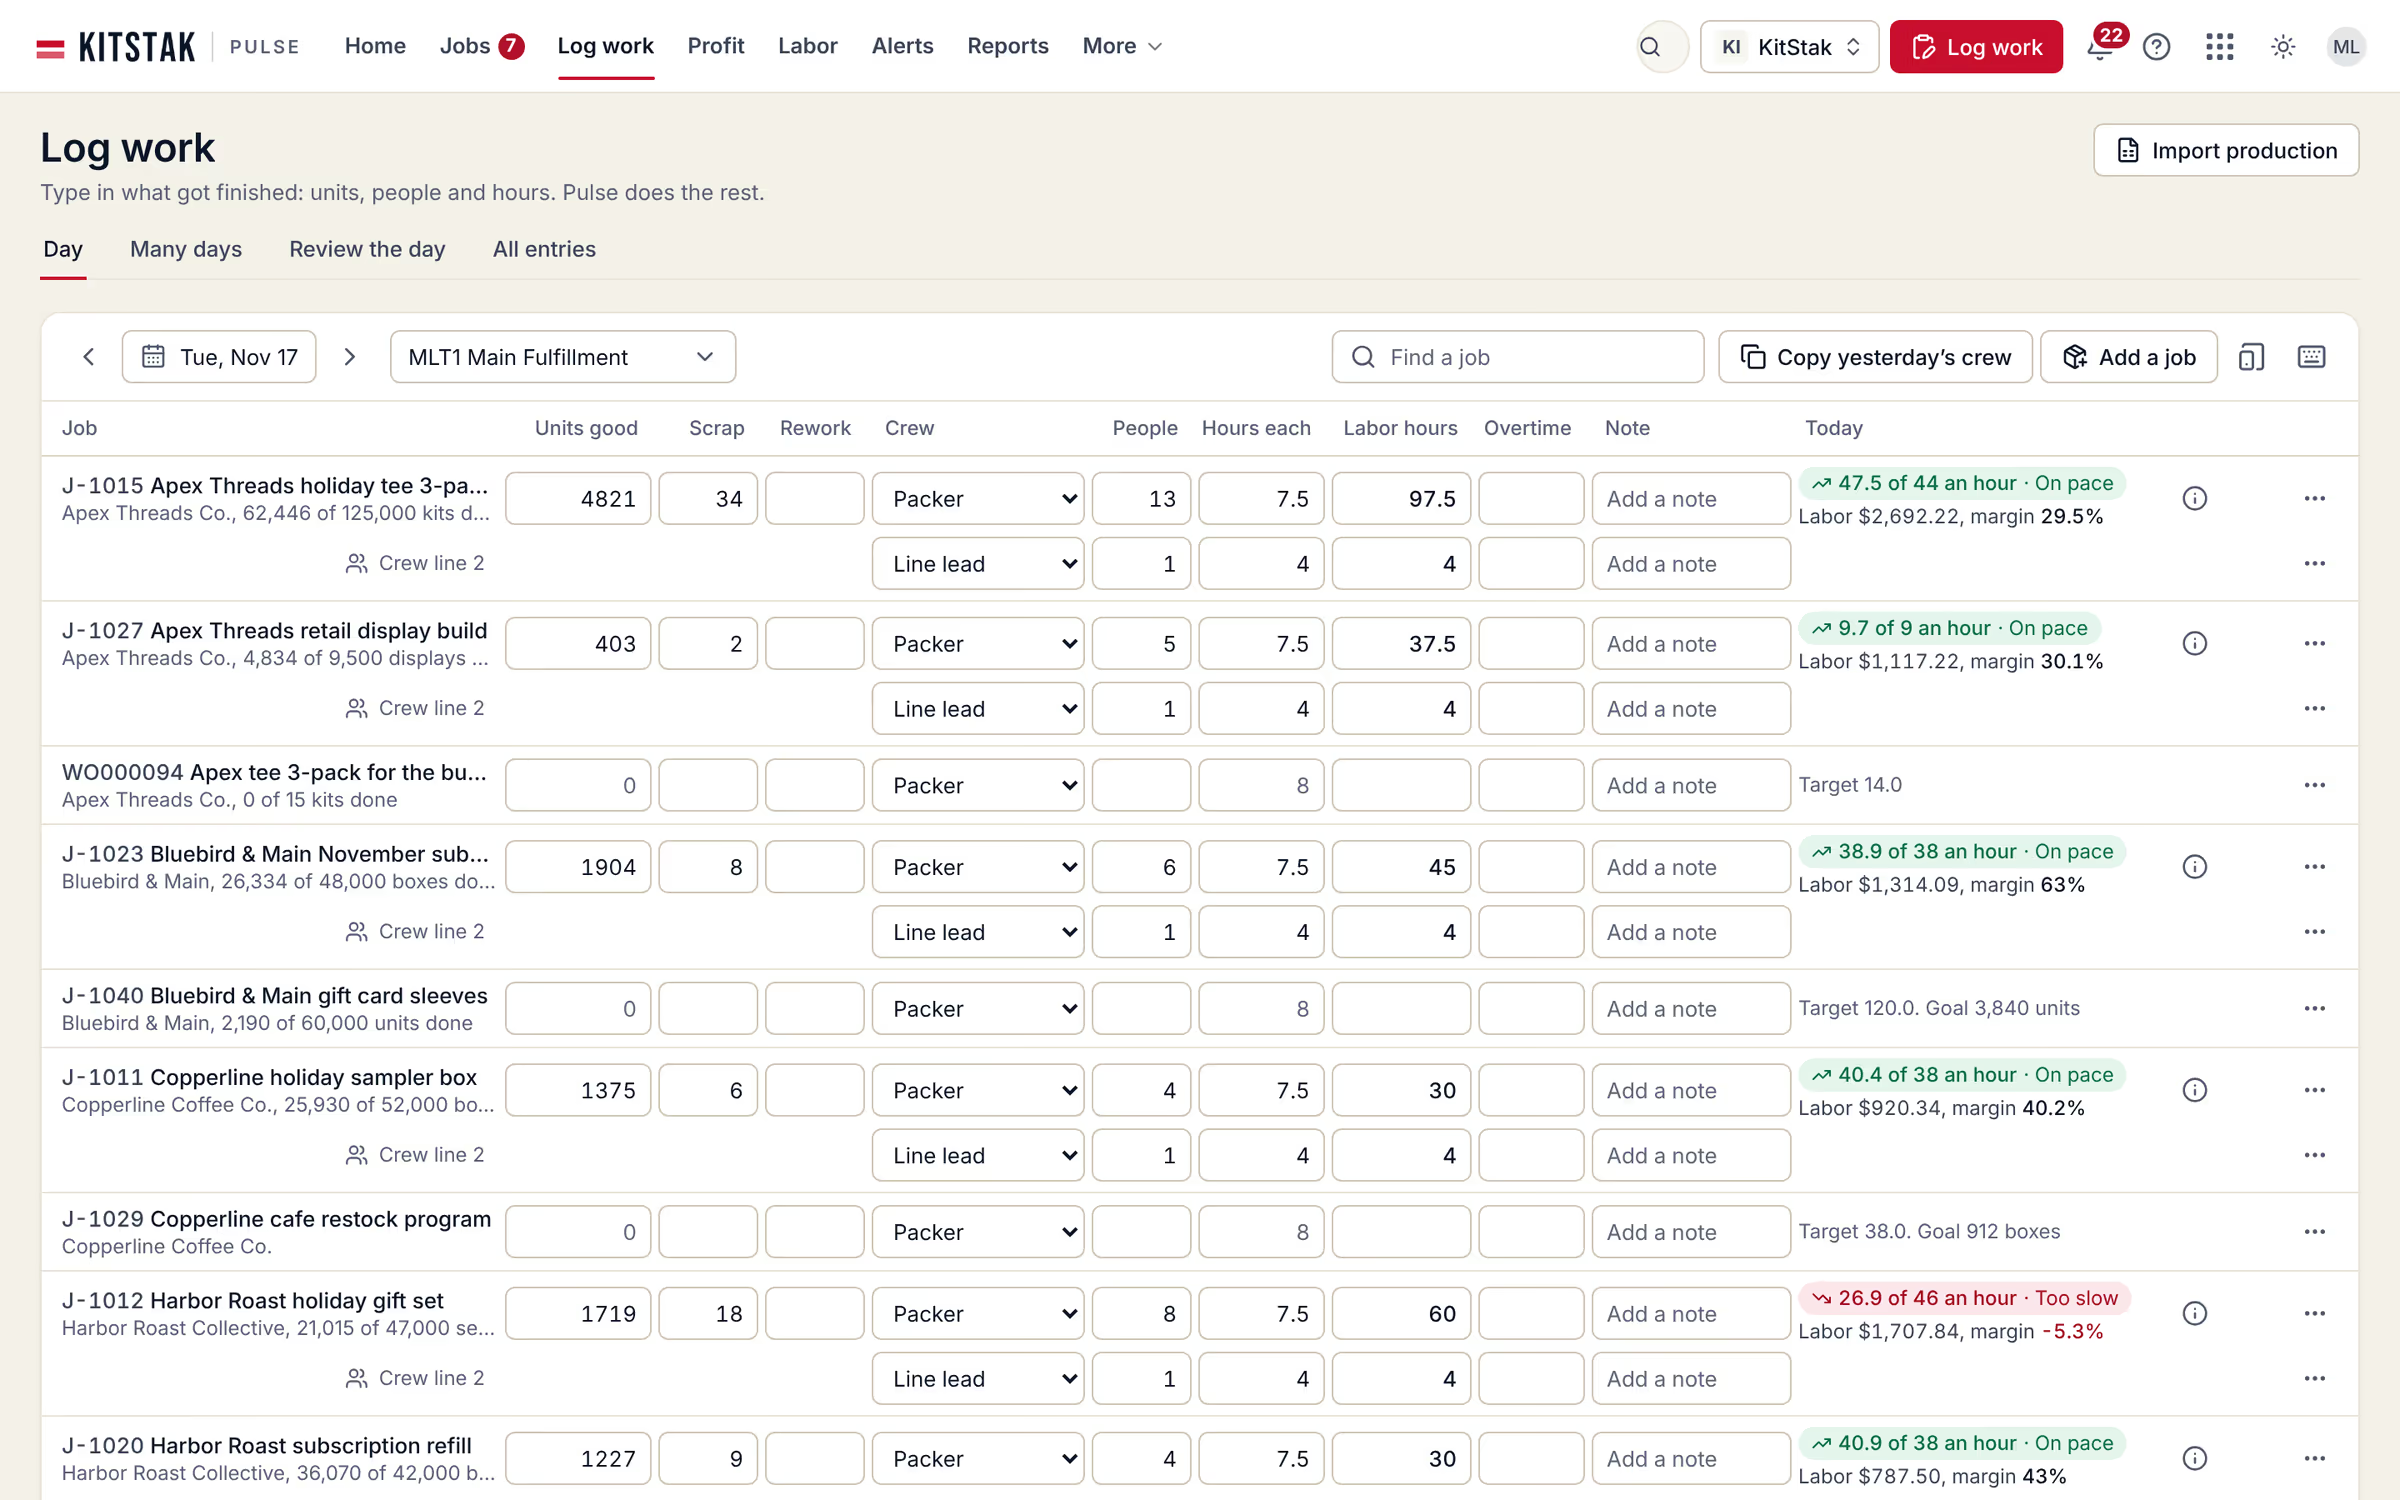
Log work lists every active job for the day. Type the units, the people and the hours. A floor lead can do the whole day at the end of a shift.
- Units, people, hoursType the good units, scrap and rework. Pick the crew, then type how many people and how many hours each. Add a second crew line for a line lead. Pulse works out the labor hours.
- Pace as you typeA filled job shows its pace against the target, as On pace or Too slow, with the labor cost and margin for the day.
- Floor tabletA shared tablet with a 4 digit PIN. It never shows money. If the wifi drops, entries wait and send later.
07Quote vs actual
See where the gap came from.
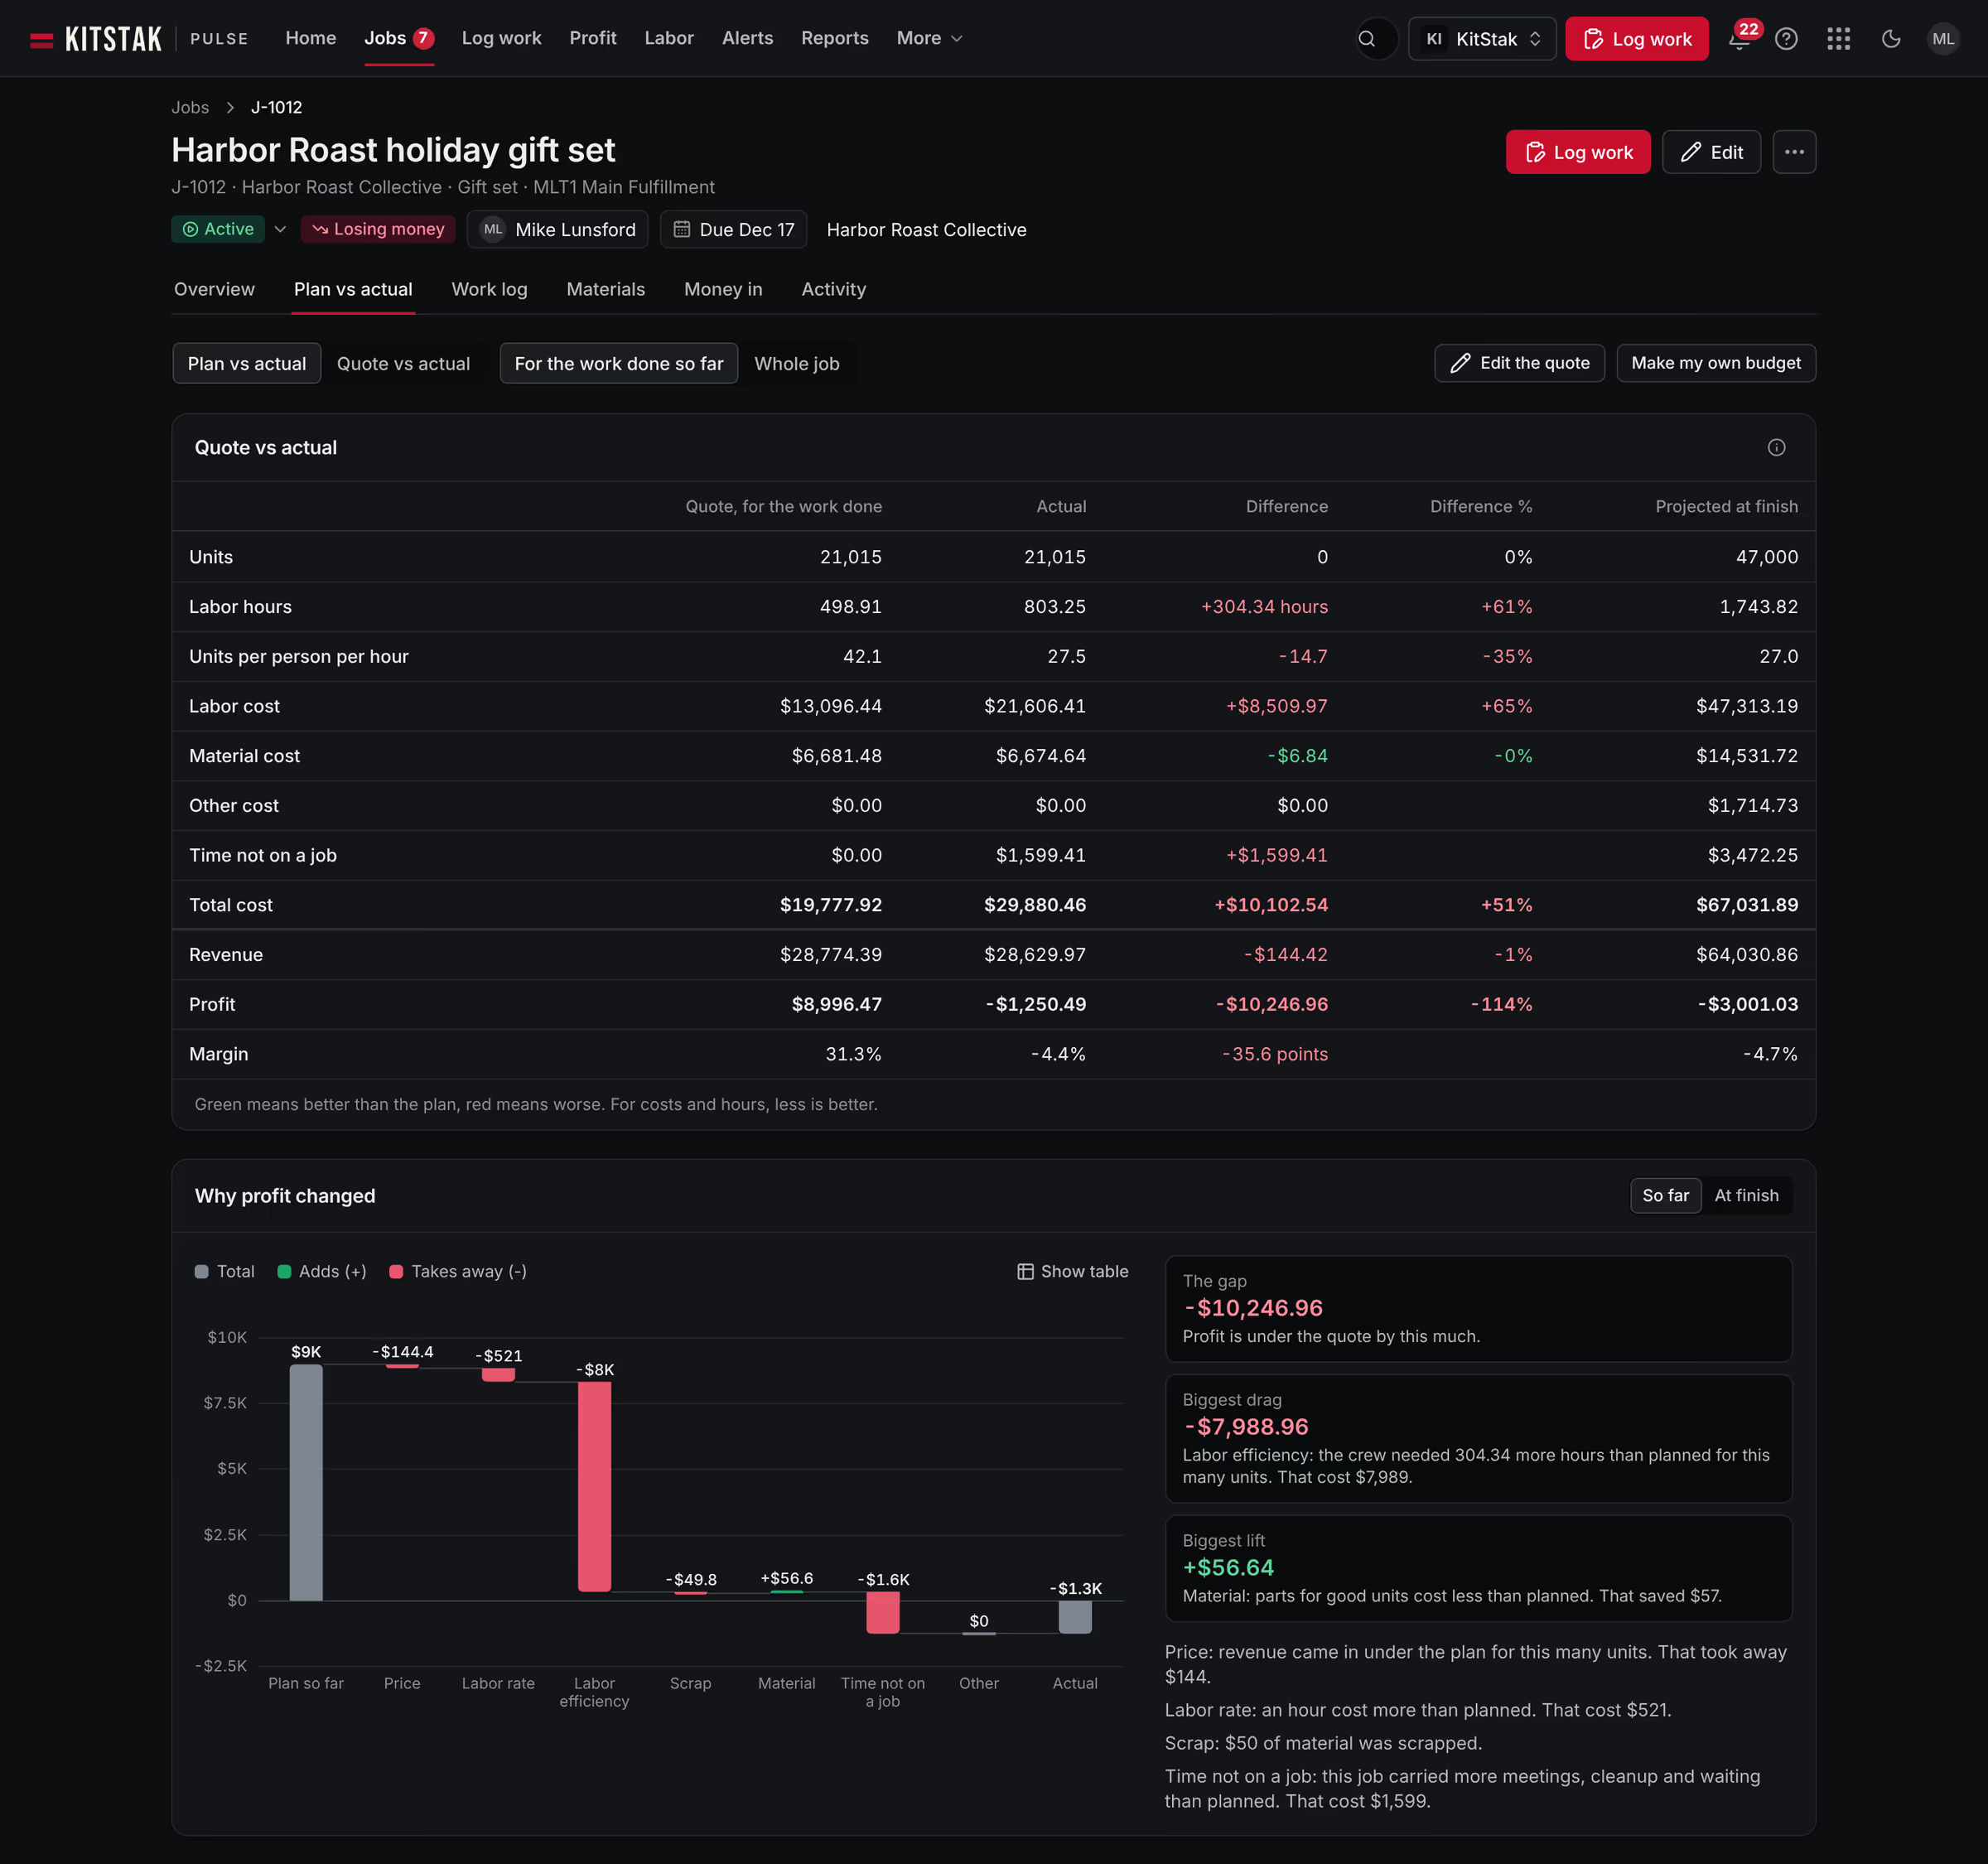
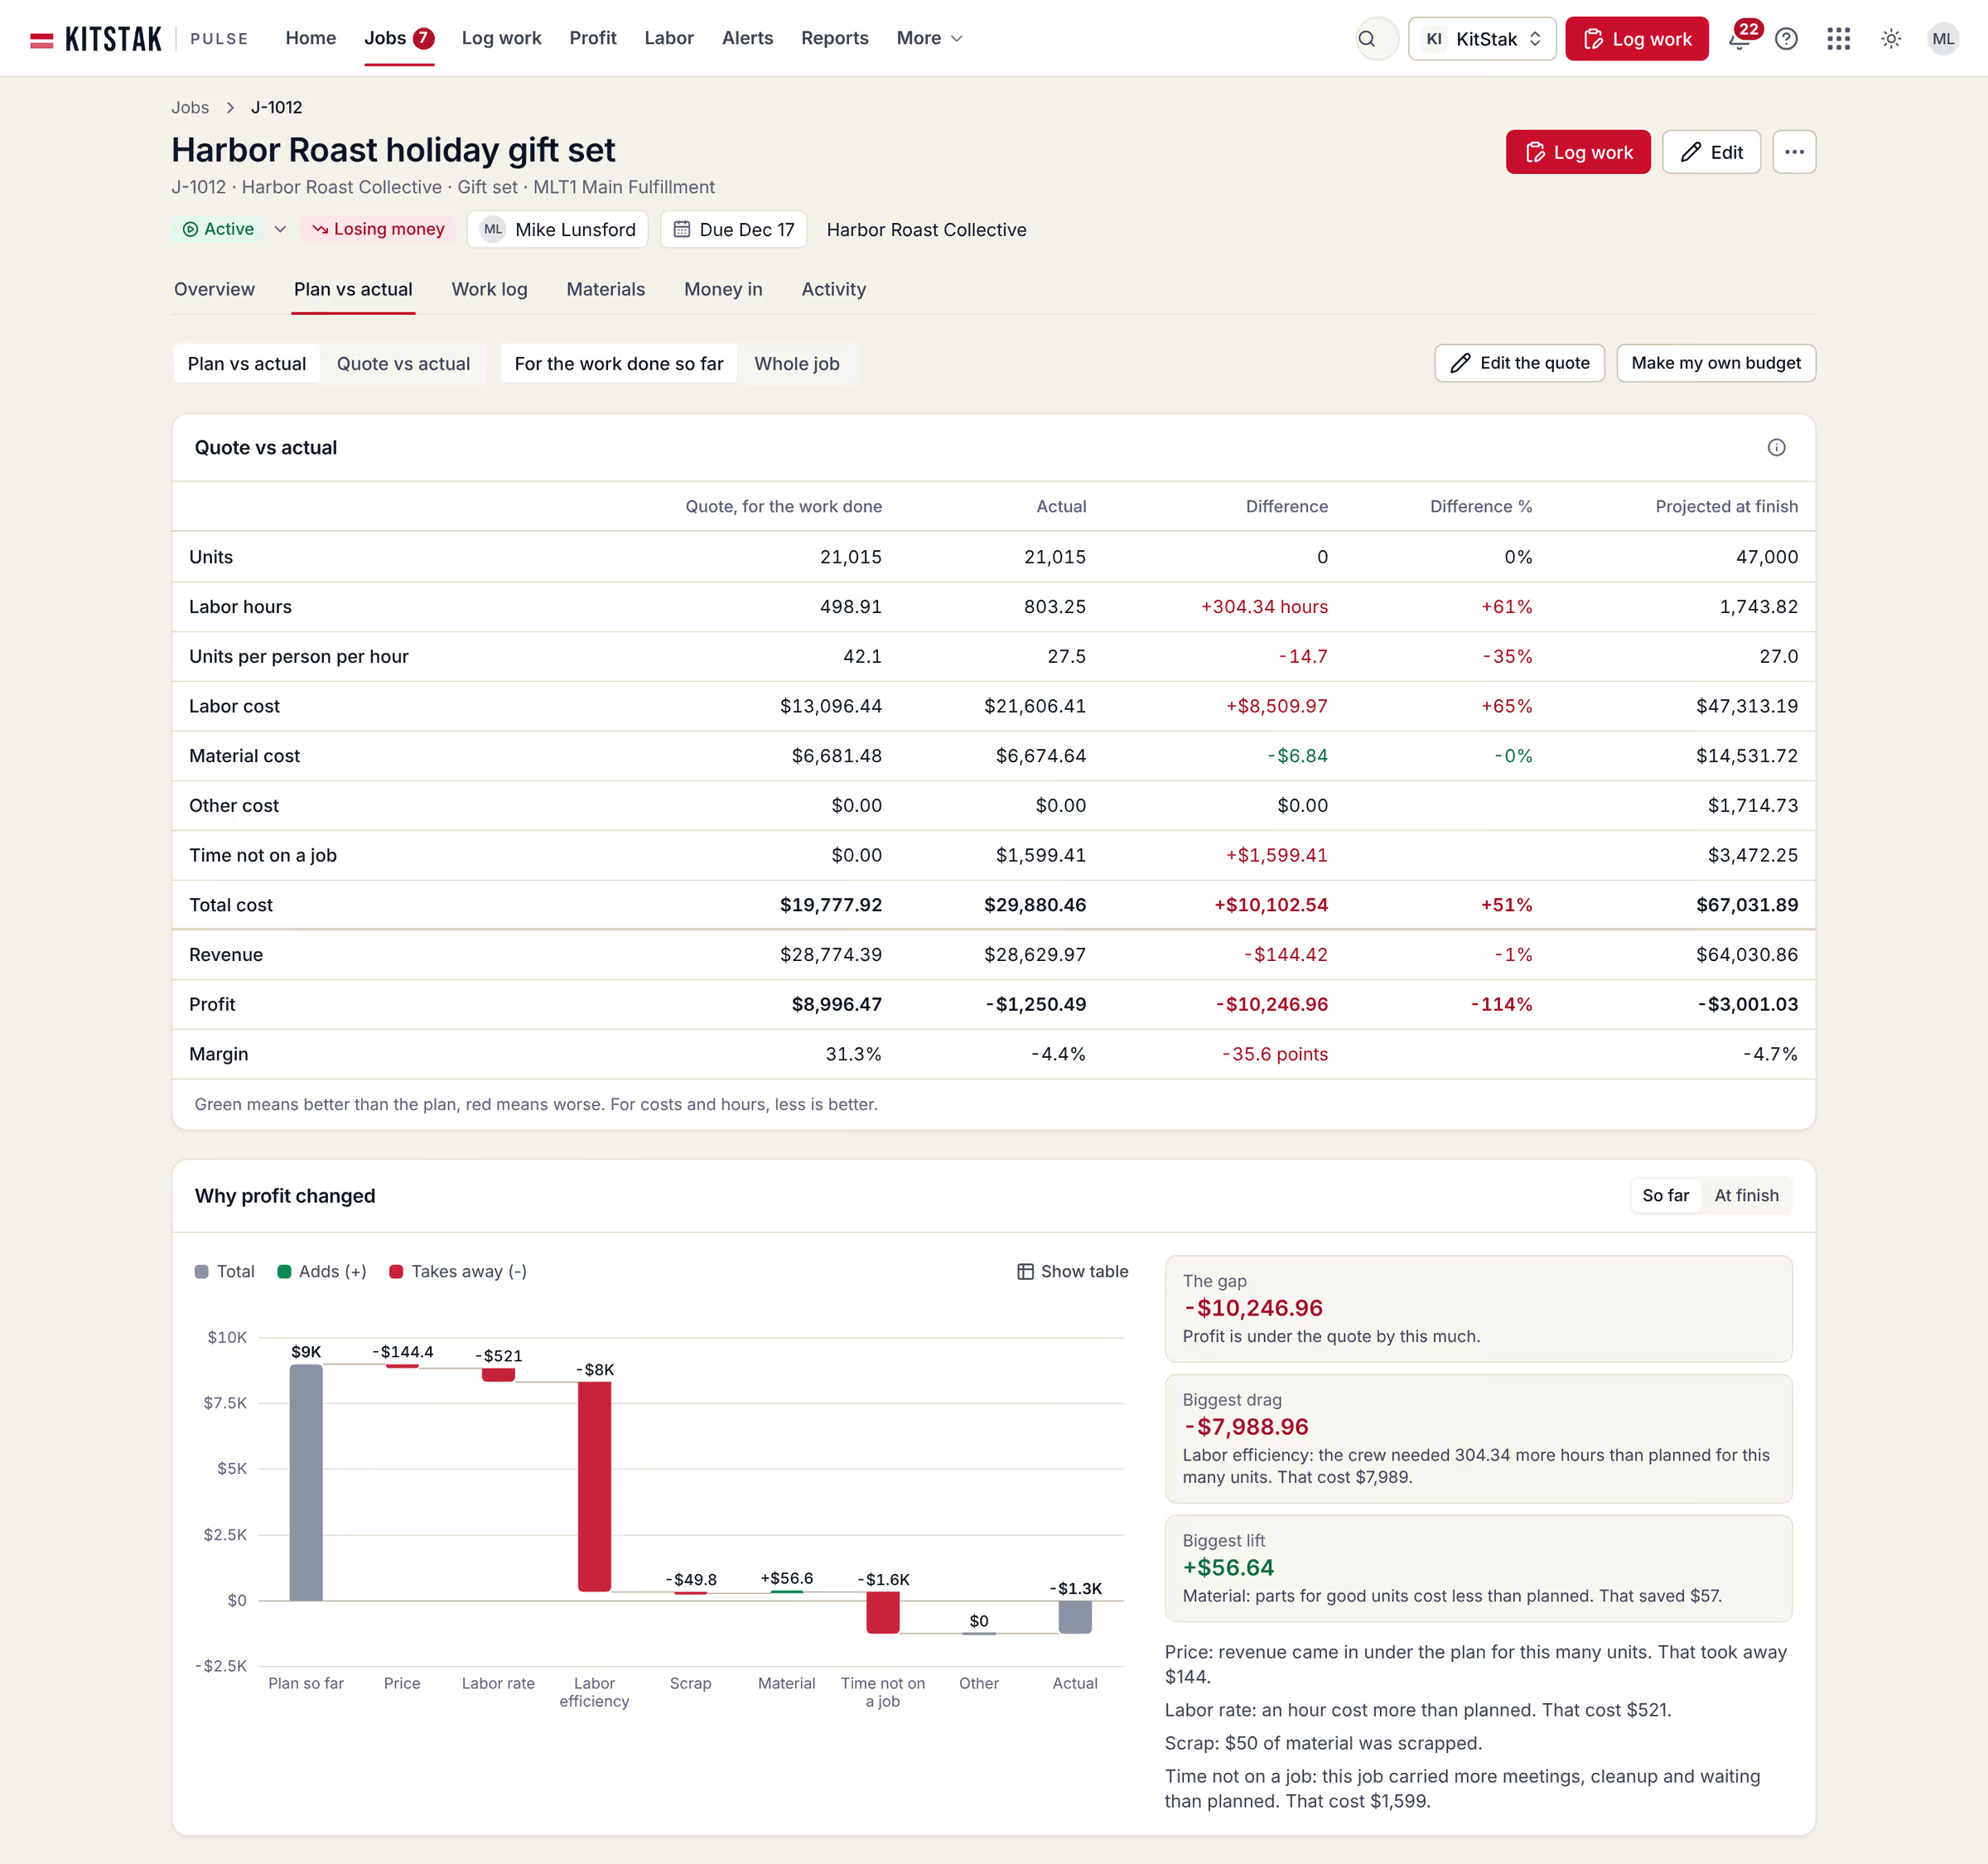
The quote is what you told the client. Actual is what happened. Pulse puts them side by side and splits the gap by cause. You can add your own budget and compare with that too.
- Quote vs actualFor an open job, the quote is scaled to the units finished so far. A half done job is judged fairly.
- Why profit changedOne chart splits the gap by cause: price, labor rate, labor efficiency, scrap, material, time not on a job and other. The bars always add up.
- The reading in wordsBeside the chart, Pulse names the gap, the biggest drag and the biggest lift, each in a plain sentence.
08Real cost of an hour
What an hour really costs.
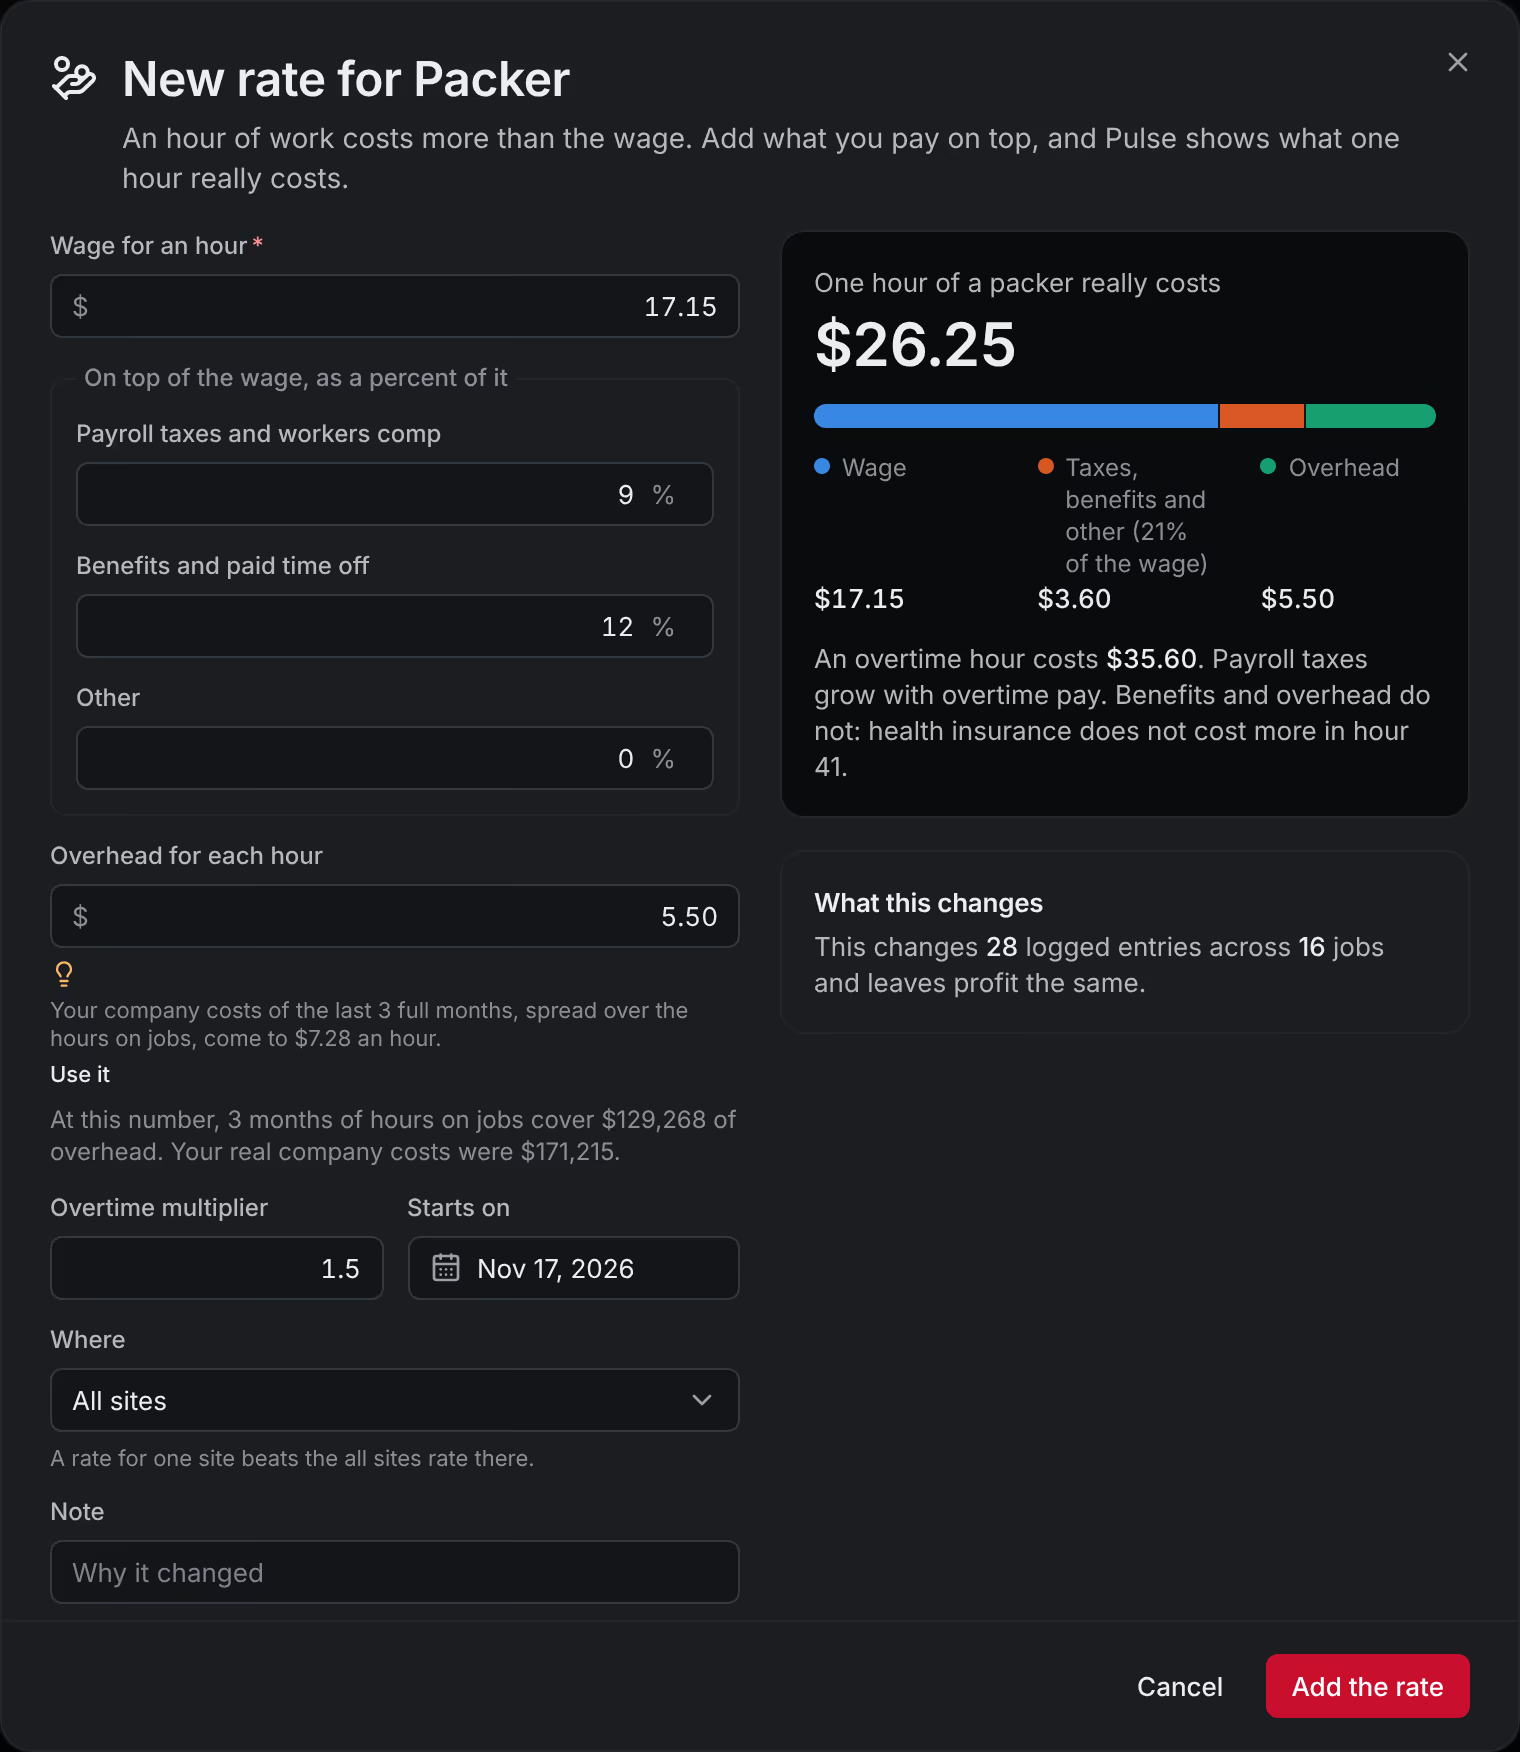
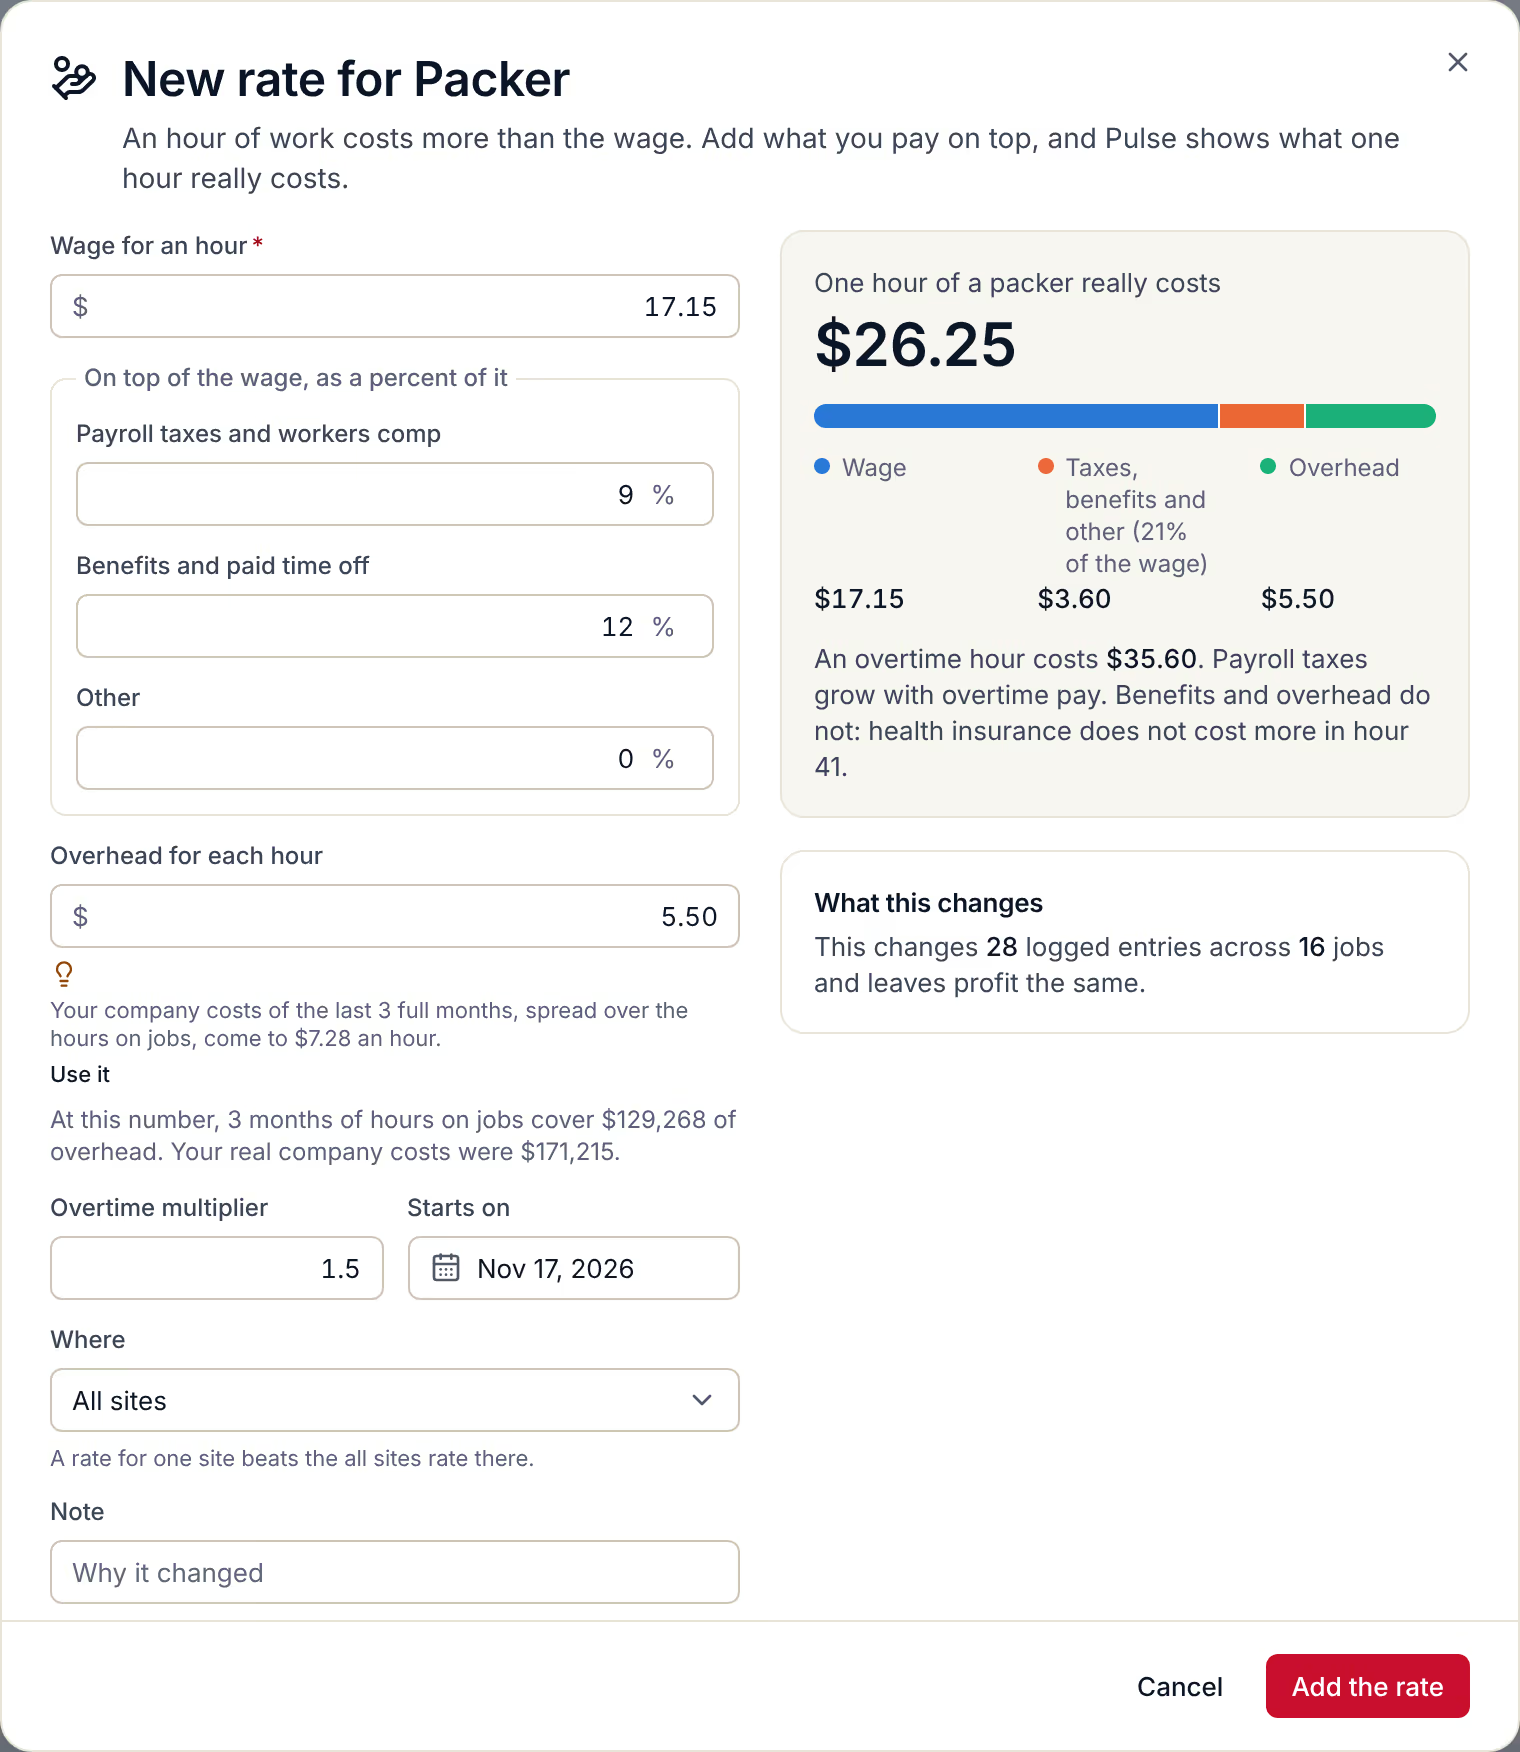
The real cost of an hour is the wage, plus payroll taxes and benefits, plus overhead for each hour. Pulse builds that rate with you for each labor class, such as packer or line lead.
- See it before you saveChange the rate, then type the wage and what you pay on top. Pulse shows what one hour really costs, what an overtime hour costs, and how many logged entries the new rate changes.
- Raises start on a dateEvery rate has a start date. A raise changes costs only from that day on.
09CSV import and export
Your data in. Your data out.
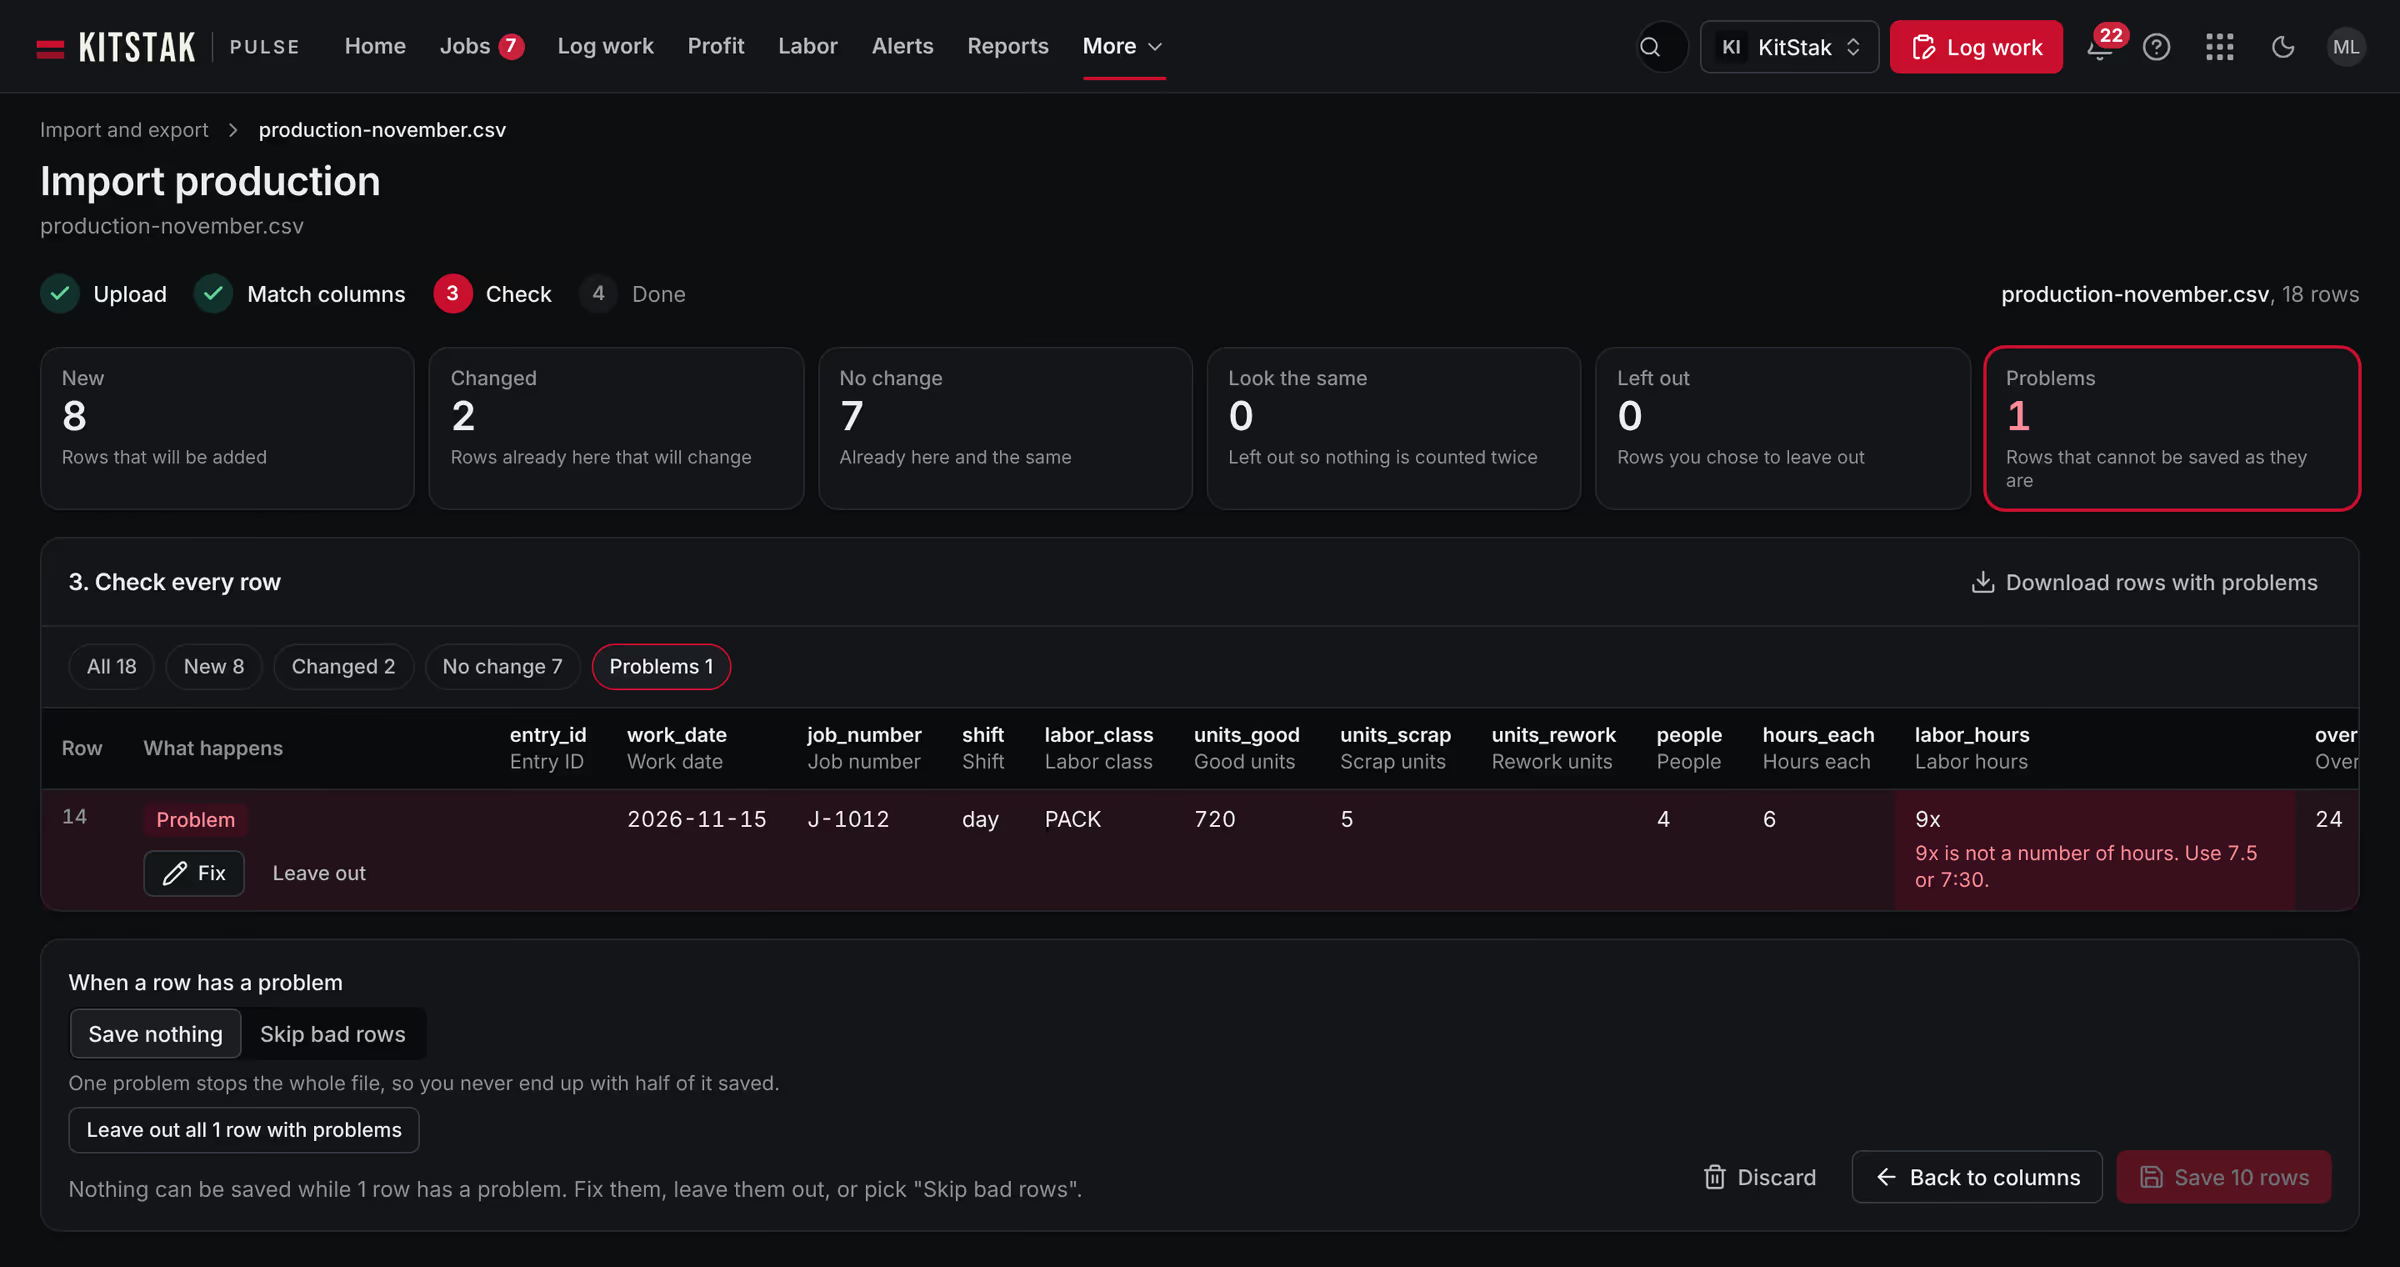
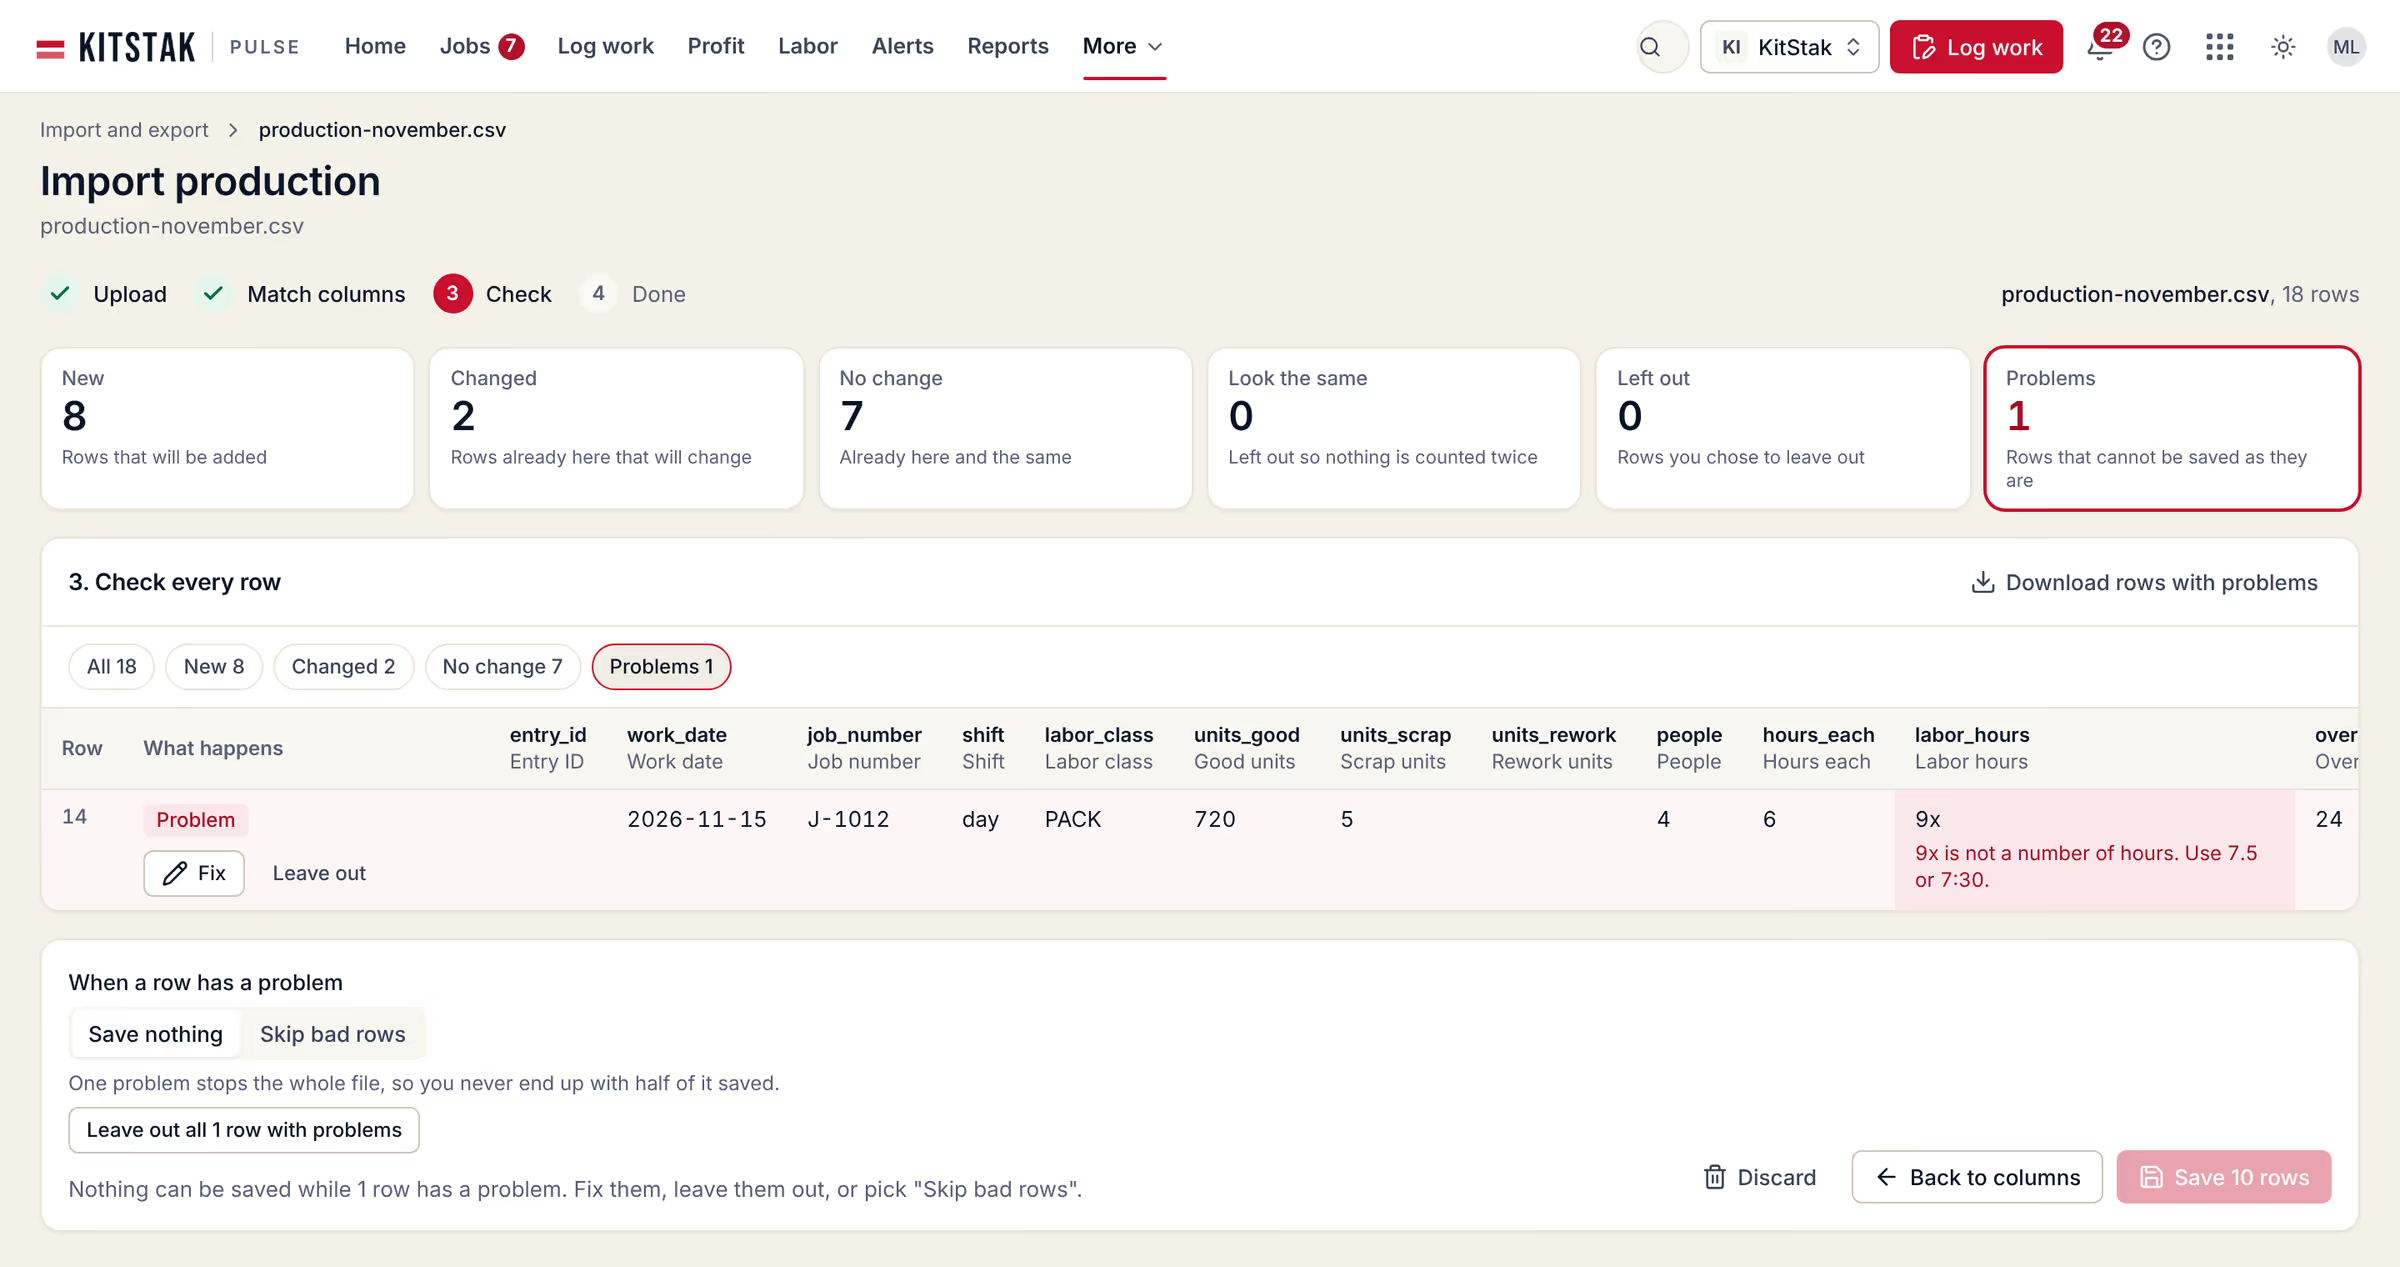
Pulse reads and writes CSV for 17 kinds of data, each with its own template. You do it yourself.
- Check before you saveStep 3, Check, sorts every row of the file: New, Changed, No change, Look the same, Left out and Problems. Each problem is named on its cell, with how to fix it.
- Export you can import againExport any kind of data in the same columns as its template. Or download everything as one zip.
Save 20% when you stack two or more
On its own. Or on the stack.
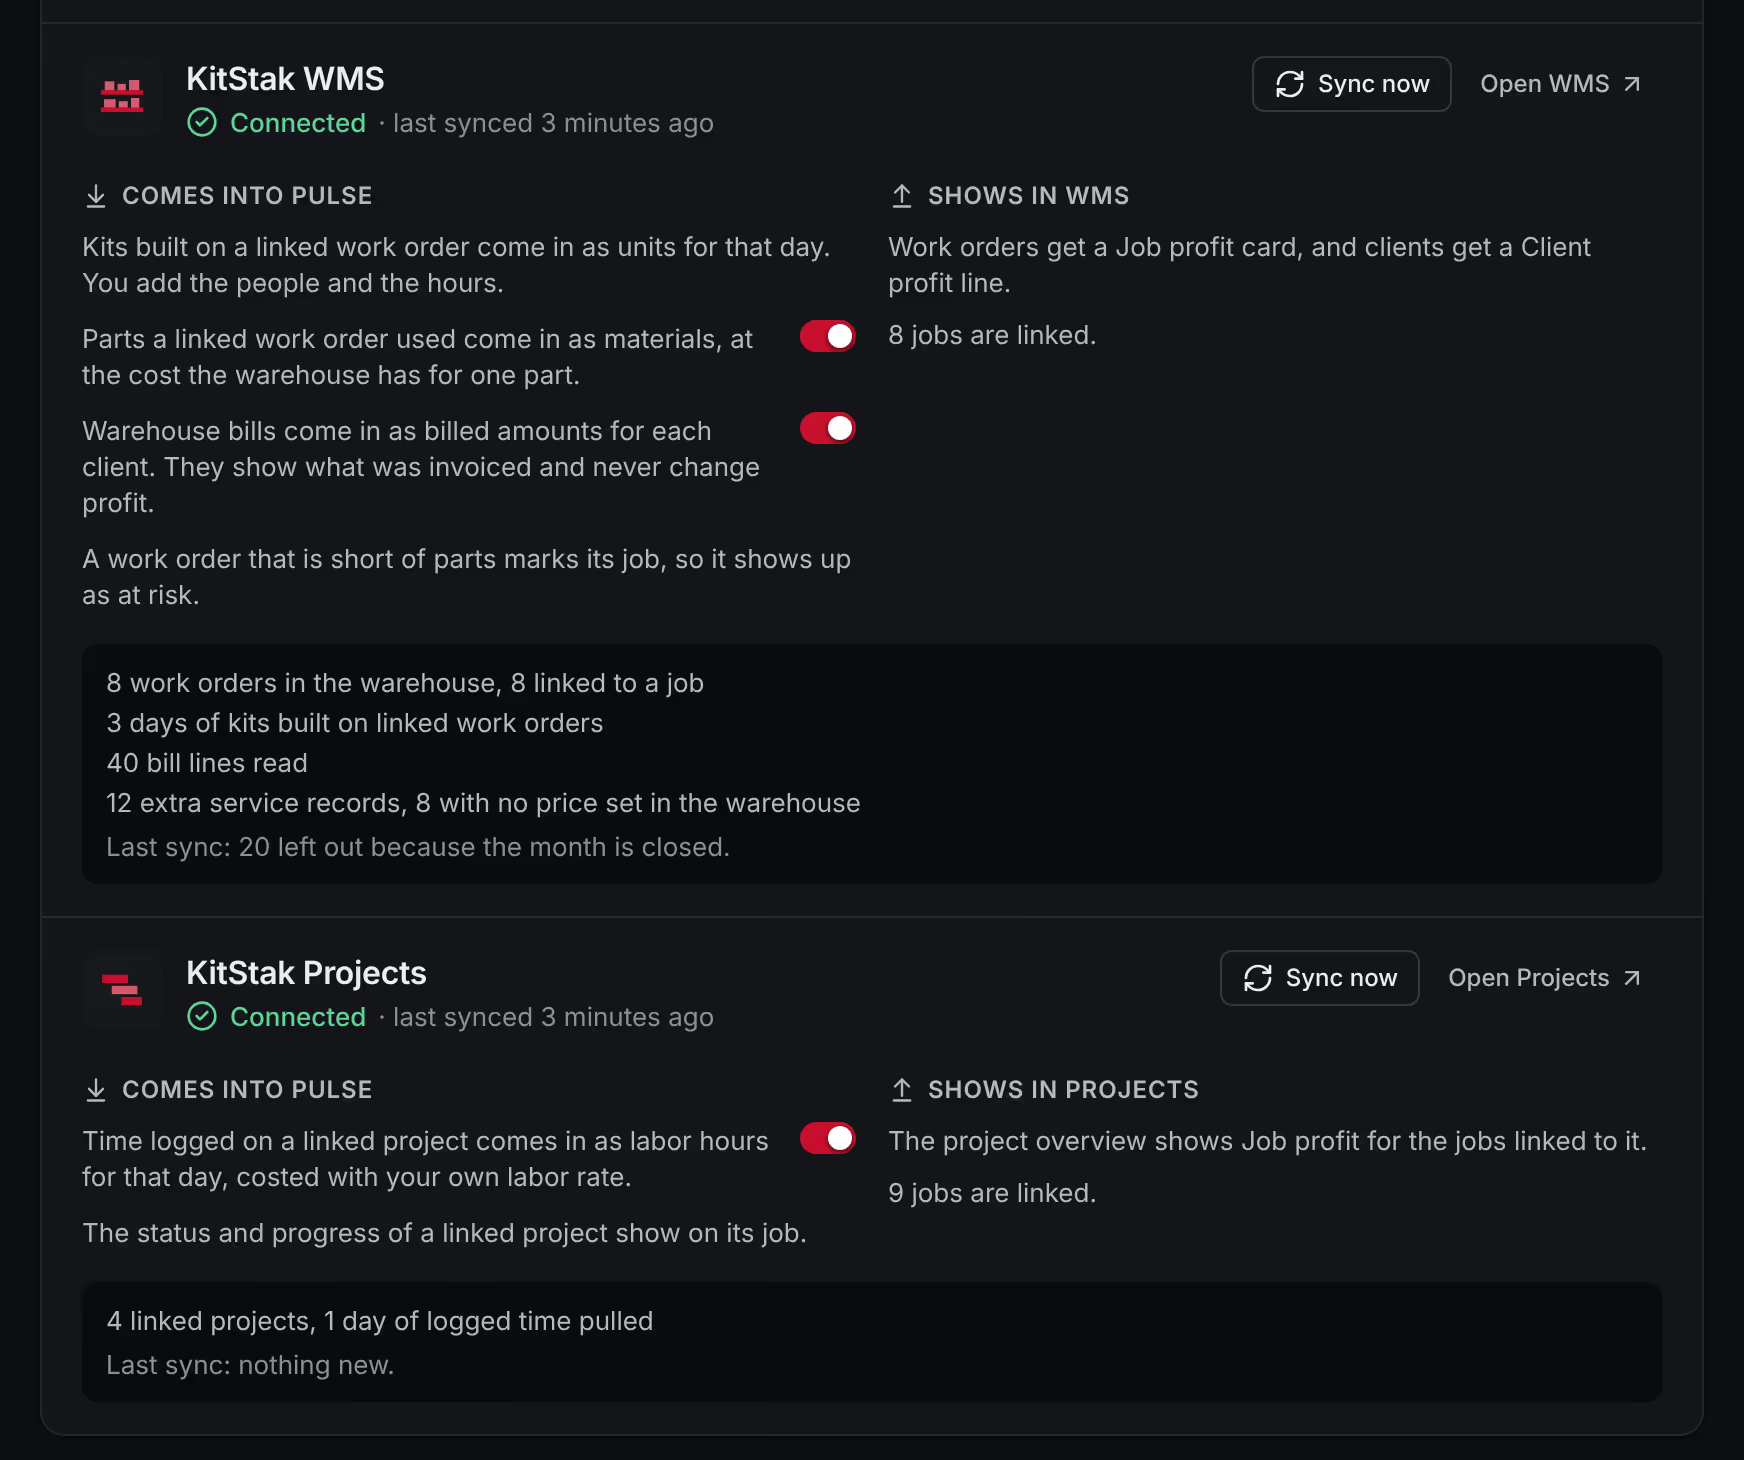
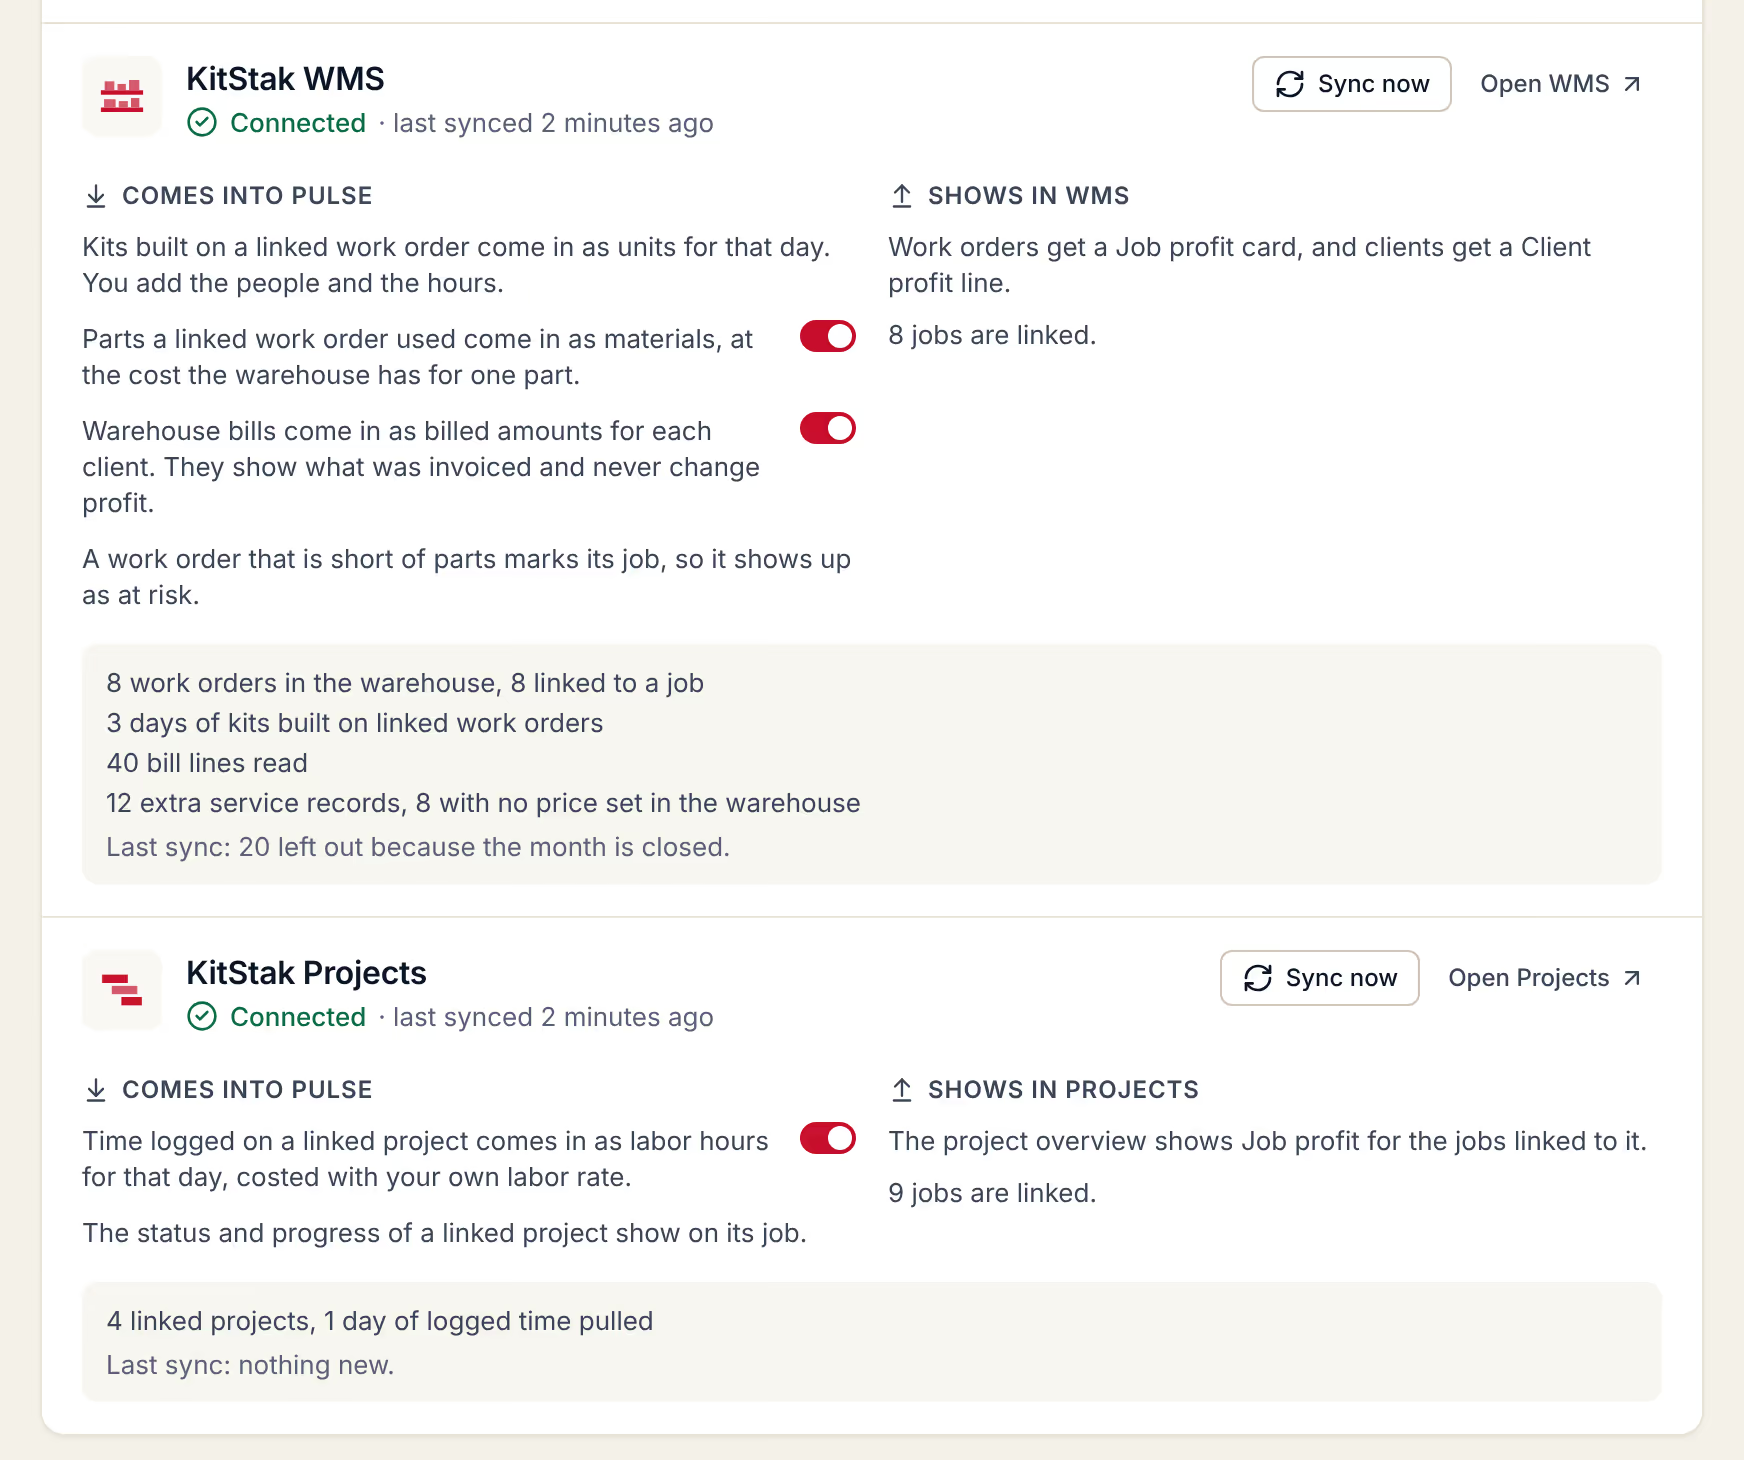
Pulse does not need any other KitStak app. Add the CRM, the WMS or Projects and Pulse pulls in what they know. They show Pulse numbers on their own screens. Pulse never changes your CRM or WMS data.
One price. Everything in it.
You get the whole product, not a starter tier. And it costs less when you run it alongside the others.
- Profit by job, job type, client and extra service
- Log work, the floor tablet and the wall display
- Quote, budget and actual, with the quote calculator
- Alerts, goals and month close
- All 19 reports and 17 CSV templates
- Links to the CRM, the WMS and Projects when you run them
KitStak PulseComing soon
$29per organization
per month
Up to 5 seats. Need more than 5 seats? Talk to us.
20% off each product when you stack two or more, and 15% off again billed yearly.
Book a walkthrough Price your stackStraight answers.
Something else on your mind? Ask us
What is KitStak Pulse, and who is it for?
Pulse is profit management for shops that work by the job: kitting, 3PL and contract packaging. A 3PL is a warehouse that ships for other companies. Pulse shows what each job earned, what it really cost, and the profit by job, job type, client and extra service. An extra service is work you bill on top of a job. Some shops call these value added services. Owners and finance or operations leads read the profit. Managers watch their jobs. Floor leads log the day.
What do I have to enter each day?
Units finished, the number of people and the hours, for each job that ran. That is the daily habit Pulse needs. You can type it, paste it from a spreadsheet, enter it on a floor tablet or import a time clock or payroll file. Prices and labor rates are set once, then changed when they change.
How does Pulse work out the real cost of an hour?
It adds the wage, payroll taxes, benefits and overhead for each hour, for each labor class. Rates have start dates, so a raise only changes costs from that day on.
How does Pulse decide a job is at risk or losing money?
For a job with a plan, it works out where the job will finish, from your recent pace and the plan. Ongoing work is judged on the last 30 days. It is plain math on your own numbers. A job is At risk when it is heading well under your target margin. It is also At risk when labor is heading well over the plan. A job is Losing money when it is heading for a loss. Pulse waits for 2 days of data, or until the job is 20% done, before it says so. You can change the limits.
Why is job profit different from company profit?
Jobs carry only the costs you put on them. The company also pays for overhead and for paid time nobody logged to a job, and Pulse shows each step from job profit to company profit.
Do I need the other KitStak apps?
No. Pulse works on its own. Every screen works, and CSV goes in and out for all 17 kinds of data. If you also run KitStak CRM, WMS or Projects, Pulse links to them, and you share one sign-in.
Can I bring in my own data and get it back out?
Yes. Each kind of data has a CSV template. You upload a file, match the columns and see a check before anything is saved. You can undo an import for 7 days, unless someone has edited those rows since. Exports use the same columns, so what you take out can go back in.
Who can see money and wages?
Owners, admins and managers see money. Nobody else does unless you turn it on. Of the 5 roles, supervisors (your floor leads) and viewers see units, hours and pace, not dollars. Managers see the real cost of an hour but never the wage.
How do I start?
Pulse is coming soon. Book a walkthrough and we will show it to you on sample data. When it opens, you can load sample data, import your spreadsheets or type your first job. Then a short checklist walks you through it: set a labor rate, add a client, add a job, log a day and see your profit. Pulse is a web app that fits a phone screen, with no app to install.
What does Pulse not do?
Pulse has no time clock of its own. Hours are typed in or come from a file. It does not send bills, and it is not payroll or accounting software. Each job has one kind of unit and one price. It has no scorecard for each worker. It does not send email, so alerts and reports stay inside Pulse. It links to the other KitStak apps only, and everything else comes in and goes out by CSV.

Know which jobs pay.
Coming soon. Book a walkthrough and we will show you Pulse on sample data.